document.querySelector('video').playbackRate = 1.2
https://en.wikipedia.org/wiki/Metascience
https://en.wikipedia.org/wiki/Replication_crisis
https://en.wikipedia.org/wiki/Reproducibility
Dr. Taylor’s Tao of data analysis:
Follow the data, and abstract as little as possible!
Occasionally, thoughtful abstraction and summary statistics will be
needed and helpful,
but much more rarely, and usually only in end-stage analysis or
automation,
not in initial exploration (initial bushwhacking science).
This class has a lot of background,
so we won’t get to actual bioinformatics methods right away,
but they will come!
Today, we will illustrate the need for a computational approach,
using neuroscience as an example.
Early studies:
Lesions (accidental and otherwise).
Neurosurgery - lesion and direct stimulation.
PET studies.
fMEG, fMRI.
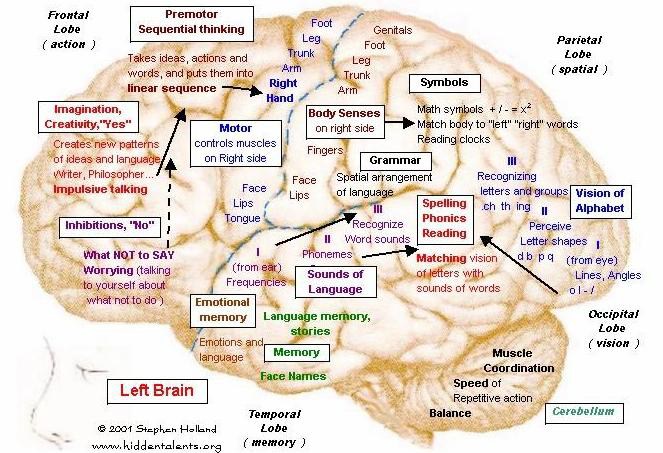
Do small brain regions perform modular functions?
What is “representation”?
Function/Representation in cortex (task fMRI)
Classic fMRI
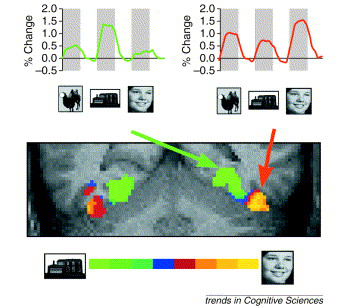
Define: Activation
Estimating the reproducibility of psychological science = 35%
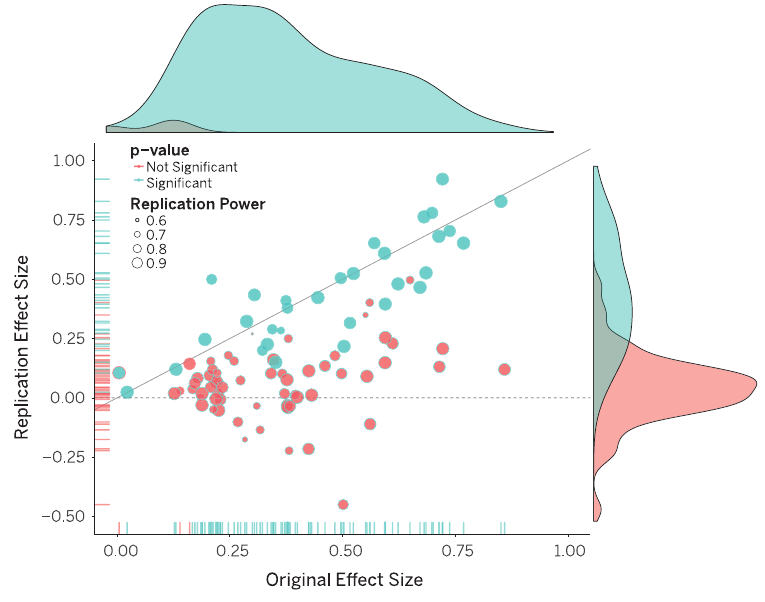
(OpenScience-Collaboration, 2015; Science)
OpenScience-Collaboration, “Estimating the reproducibility of
psychological science.,” Science, vol. 349, p. aac4716, Aug. 2015.
Single study fMRI: What stinks?
Does anyone know what kind of animal this is with “significant”
activations in its brain?
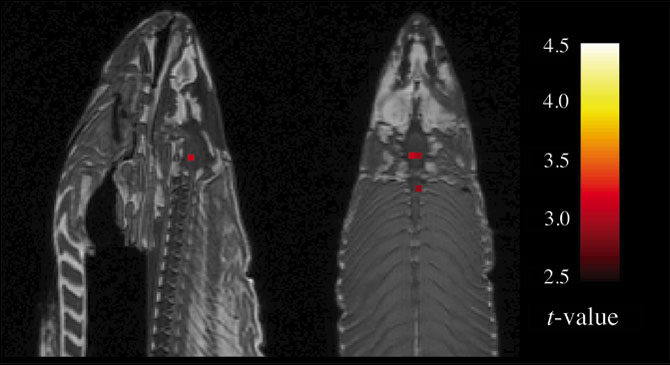
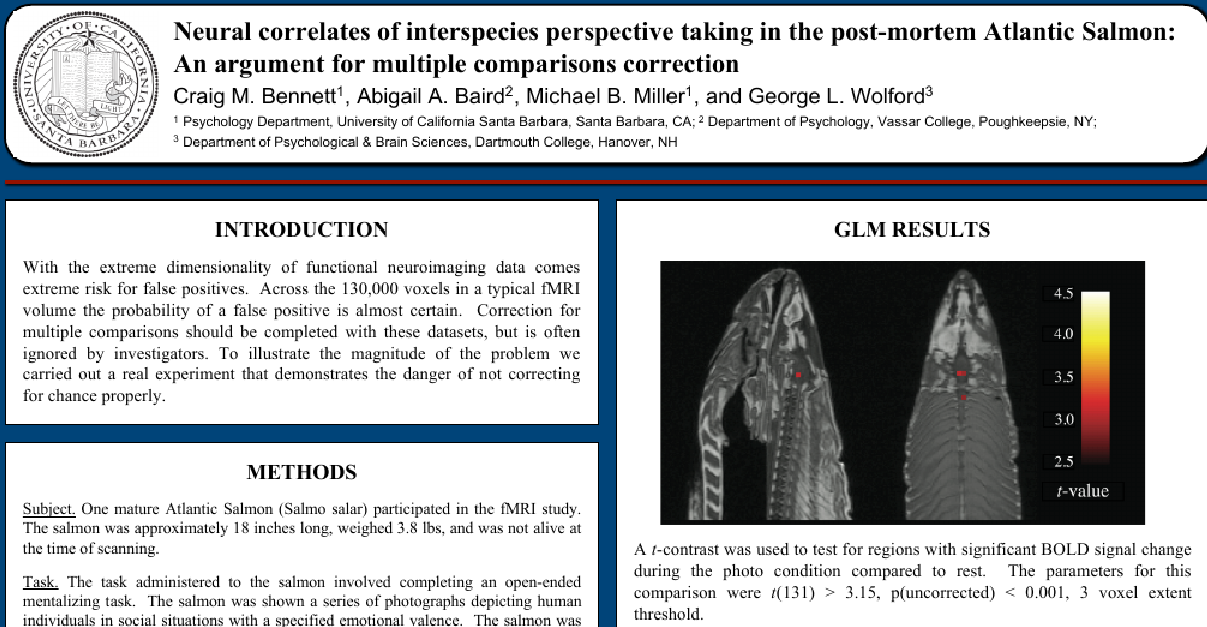
C. M. Bennett, M. B. Miller, and G. L. Wolford,
“Neural correlates of inter-species perspective taking in the
post-mortem atlantic salmon:
An argument for multiple comparisons correction,”
NeuroImage, vol. 47, no. 1, p. S125, 2009.

“There is increasing concern that most current published research
findings are false. In this framework, a research finding is less likely
to be true when the studies conducted in a field are smaller; when
effect sizes are smaller; when there is a greater number and lesser
pre-selection of tested relationships; where there is greater
flexibility in designs, definitions, outcomes, and analytical modes;
when there is greater financial and other interest and prejudice; and
when more teams are involved in a scientific field in chase of
statistical significance. Simulations show that for most study designs
and settings, it is more likely for a research claim to be false than
true. Moreover, for many current scientific fields, claimed research
findings may often be simply accurate measures of the prevailing
bias.”
J. P. A. Ioannidis, “Why most published research findings are false,”
PLoSMed, vol. 2, no. 8, p. e124, 2005.
e.g. discuss irradiating infant thymuses, statins, social psychology, nutrition research, Alzheimer’s drugs, etc.
01-eScience/edwards-2017.pdf
Reggretably, at this point in time, the proporion of legitimate high
quality science drops substantially each year.
Academics (people) are not so rational about distributing research efforts or money to problems.
Red = popularly studied (Behrens, 2012)
Impact factor correlations (Behrens, 2012)
Picking the wrong brain region is a bad career move…
https://en.wikipedia.org/wiki/Publication_bias
https://www.science.org/content/blog-post/just-bribe-everyone-it-s-only-scientific-record
https://www.science.org/content/article/paper-mills-bribing-editors-scholarly-journals-science-investigation-finds
https://cacm.acm.org/magazines/2019/9/238959-an-inability-to-reproduce/fulltext
http://blogs.nature.com/news/2012/12/is-the-scientific-literature-self-correcting.html
Can’t find a taxpayer-funded publication behind a for-profit paywall,
just read this article from the journal Science:
http://www.sciencemag.org/news/2016/04/whos-downloading-pirated-papers-everyone
http://www.sciencemag.org/news/2016/04/alexandra-elbakyan-founded-sci-hub-thwart-journal-paywalls?IntCmp=scihub-1-11
Hint: Can you find the .onion?
D. Butler, “Biologists join physics preprint club,” Nature, vol. 425,
pp. 548–548, Oct. 2003.
Delamothe, R. Smith, M. A. Keller, J. Sack, and B. Witscher, “Netprints:
the next phase in the evolution of biomedical publishing,” BMJ,
vol. 319, pp. 1515–1516, Dec. 1999.
Van Noorden, “Mathematicians aim to take publishers out of publishing,”
Nature, Jan. 2013.
http://genomesunzipped.org/2011/07/why-publish-science-in-peer-reviewed-journals.php
Manual meta-analysis of function performs ok…
What enabled the industrial revolution?
Craftsperson to Assembly line.
 =>
=> 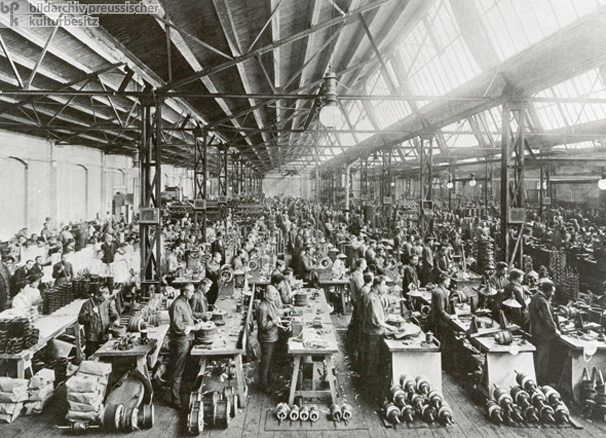
Large scale cooperation requires standardization, and precision.
A cool, related video series:
https://www.youtube.com/watch?v=gNRnrn5DE58&list=PLyvS3q4dHDYZZvBYOdy9vyNbkMyEH-eRg
(GDP)
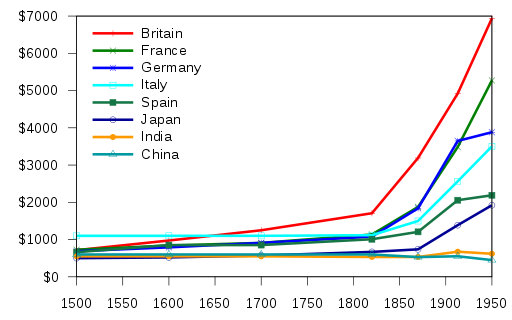
Can standardization speed scientific progress as well?
Craftsperson scientist: Single study versus ?
=>
=> ??
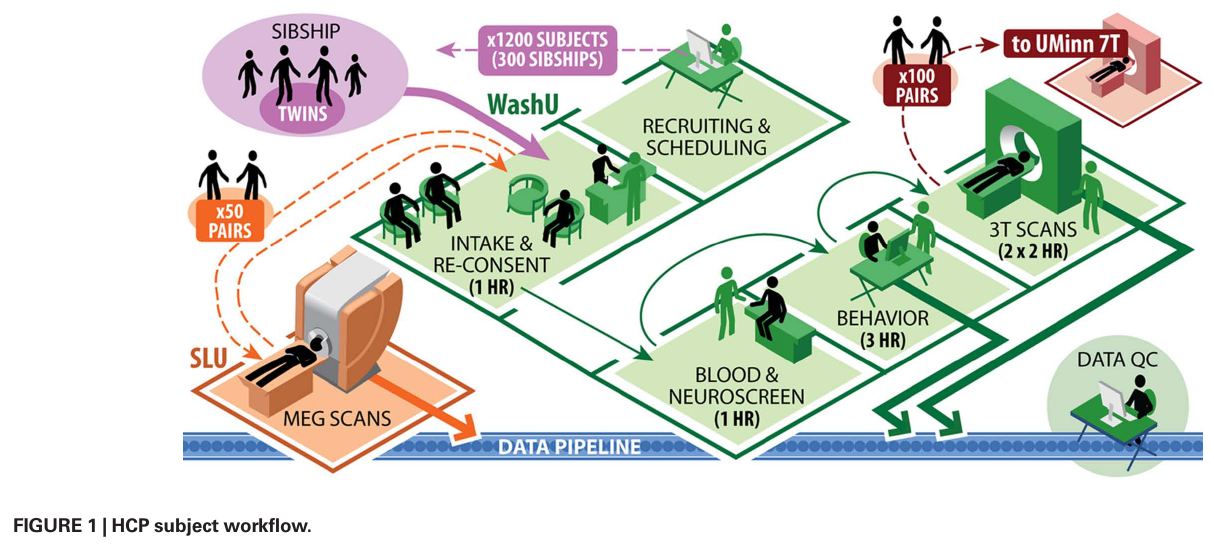
Solution 2: Very large projects

WU-Minn-Oxford group (the good one of the pair of schools doing this
project)
First group alone was 1200 healthy adults, 300 twin pairs and their
siblings.
Extensive demographic and behavioral data, heritability, blood for
genotyping, GWAS (genome wide association study).
7T MR scanners, Resting-state fMRI, Task-evoked fMRI, Diffusion MRI with
tractography analysis, MEG/EEG imaging on a subset of 100 subjects,
including both resting-state MEG/EEG and task-evoked MEG/EEG, same tasks
and timing as will be used in T-fMRI.
Structural data were used for connectivity (above).
Functional data used for meta-optimization (upcoming).
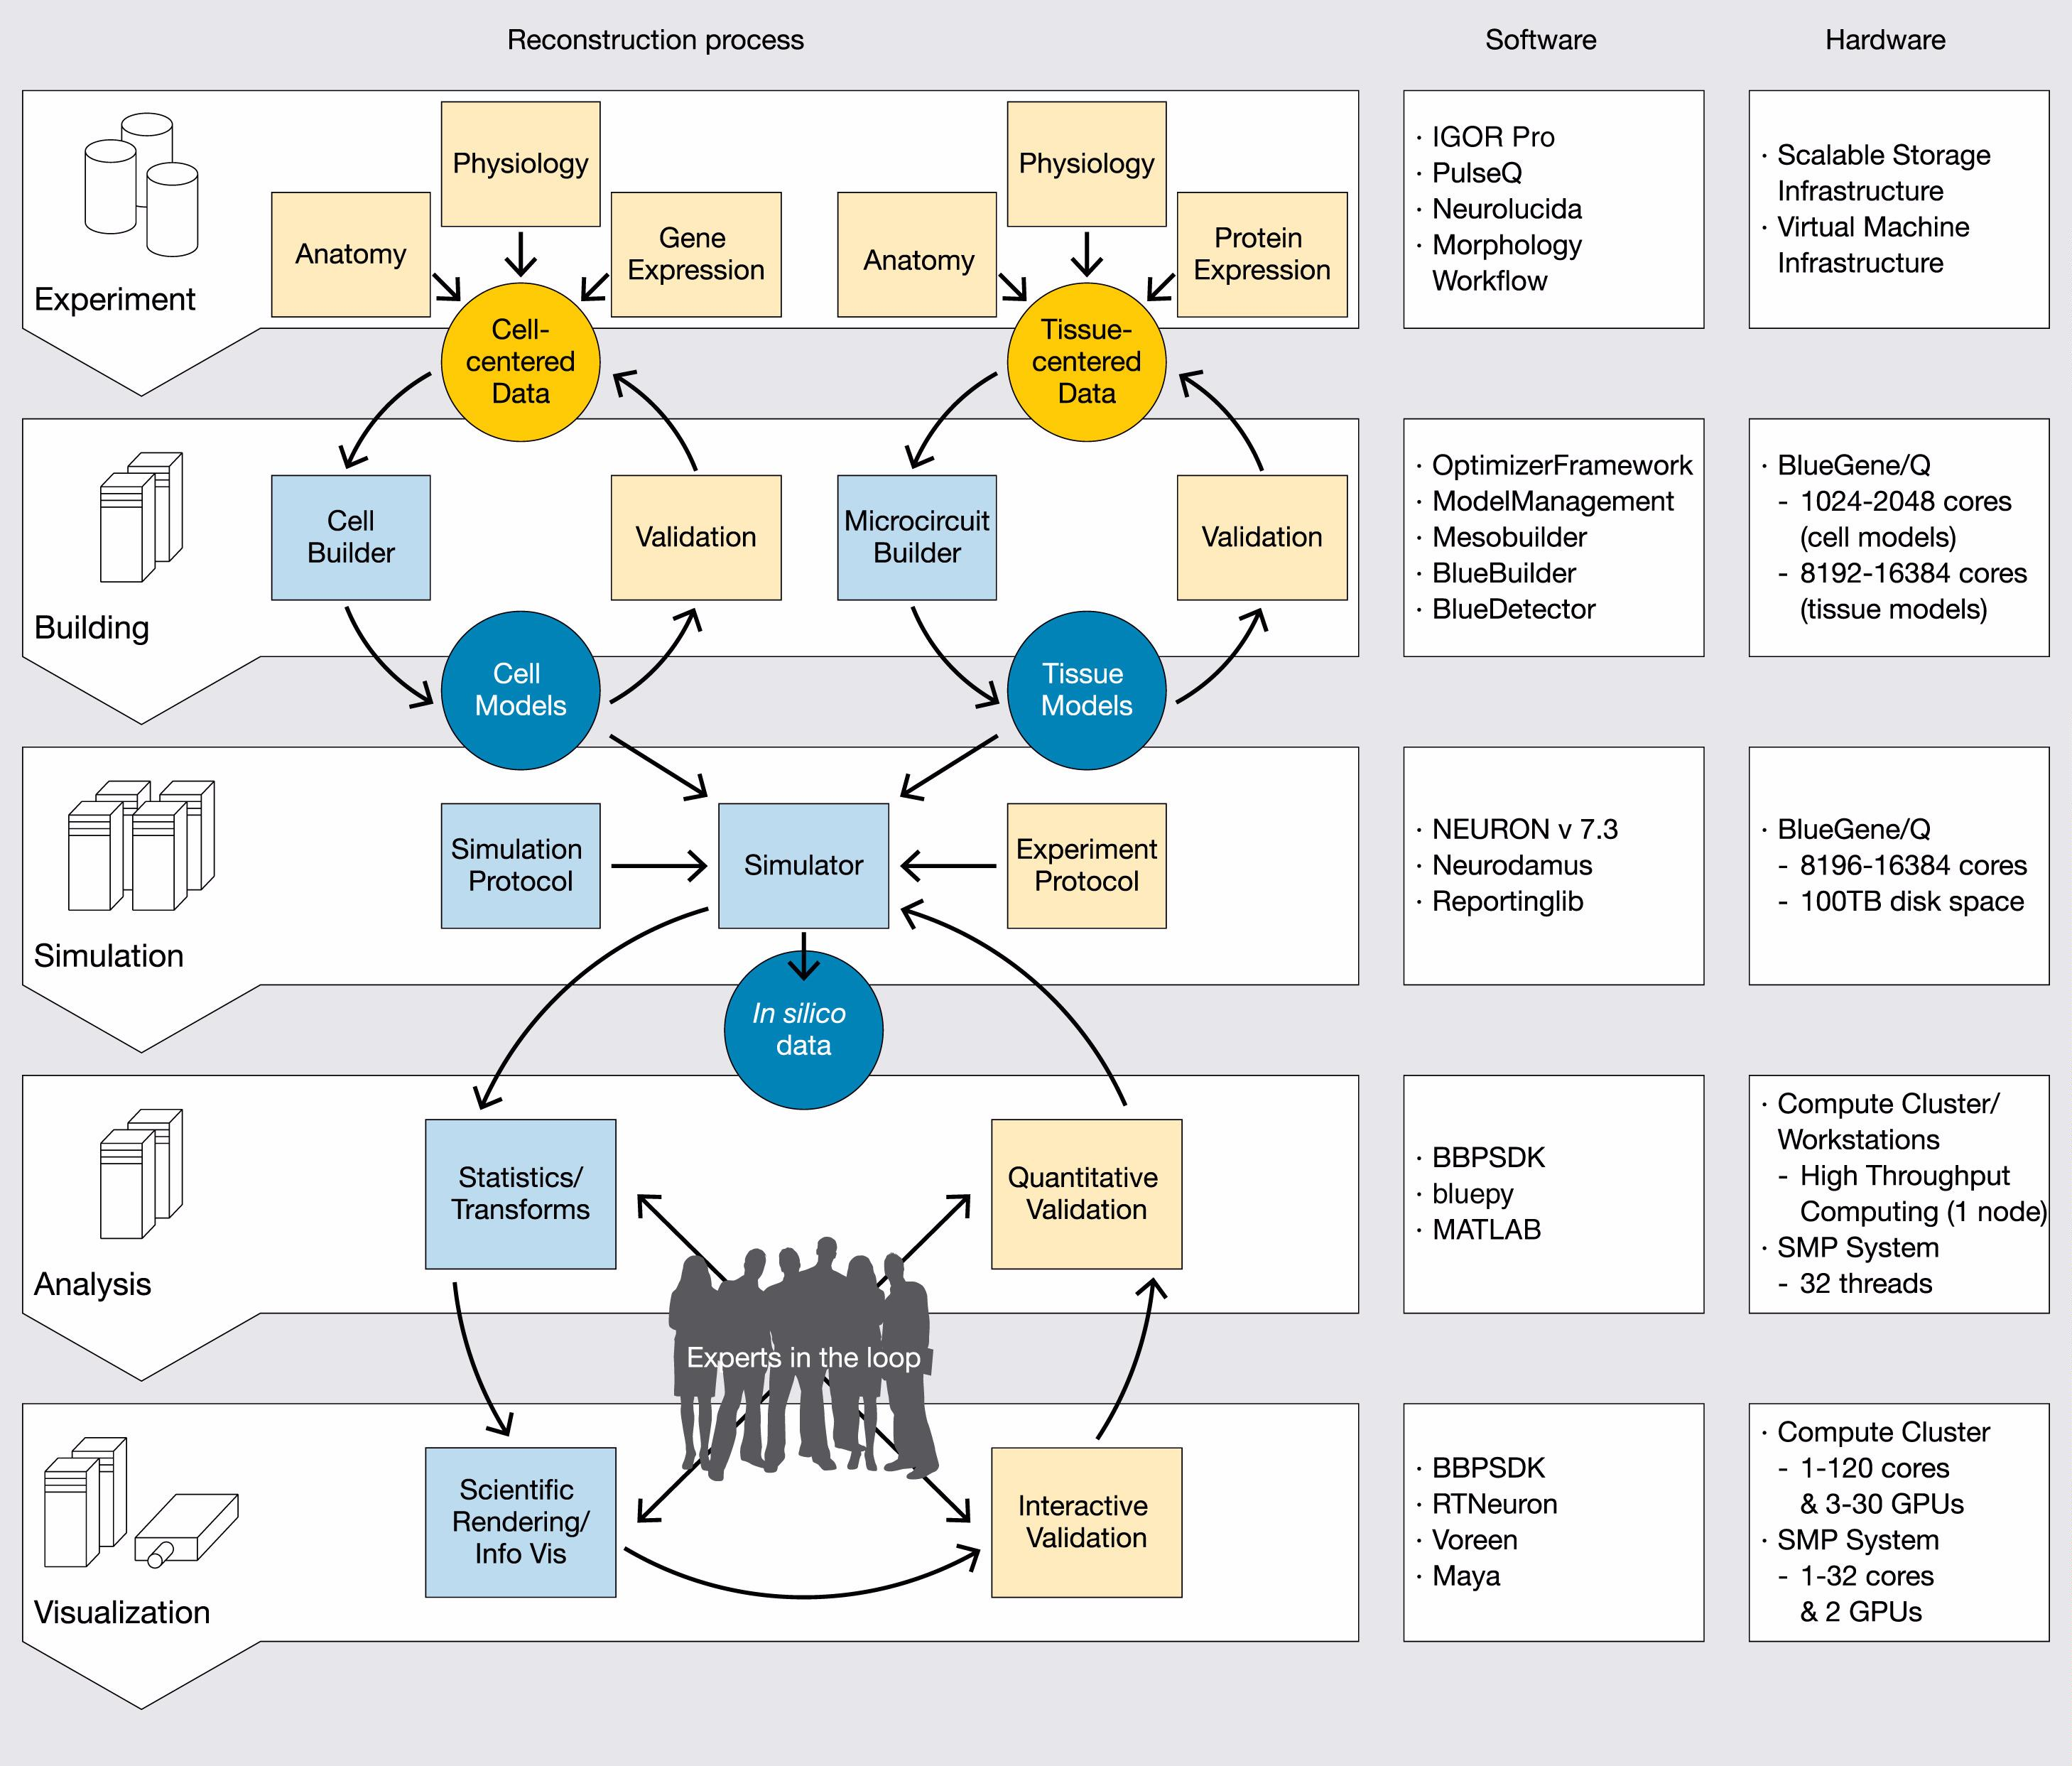
Blue Brain Project Digital reconstruction of the brain by
reverse-engineering mammalian brain circuitry
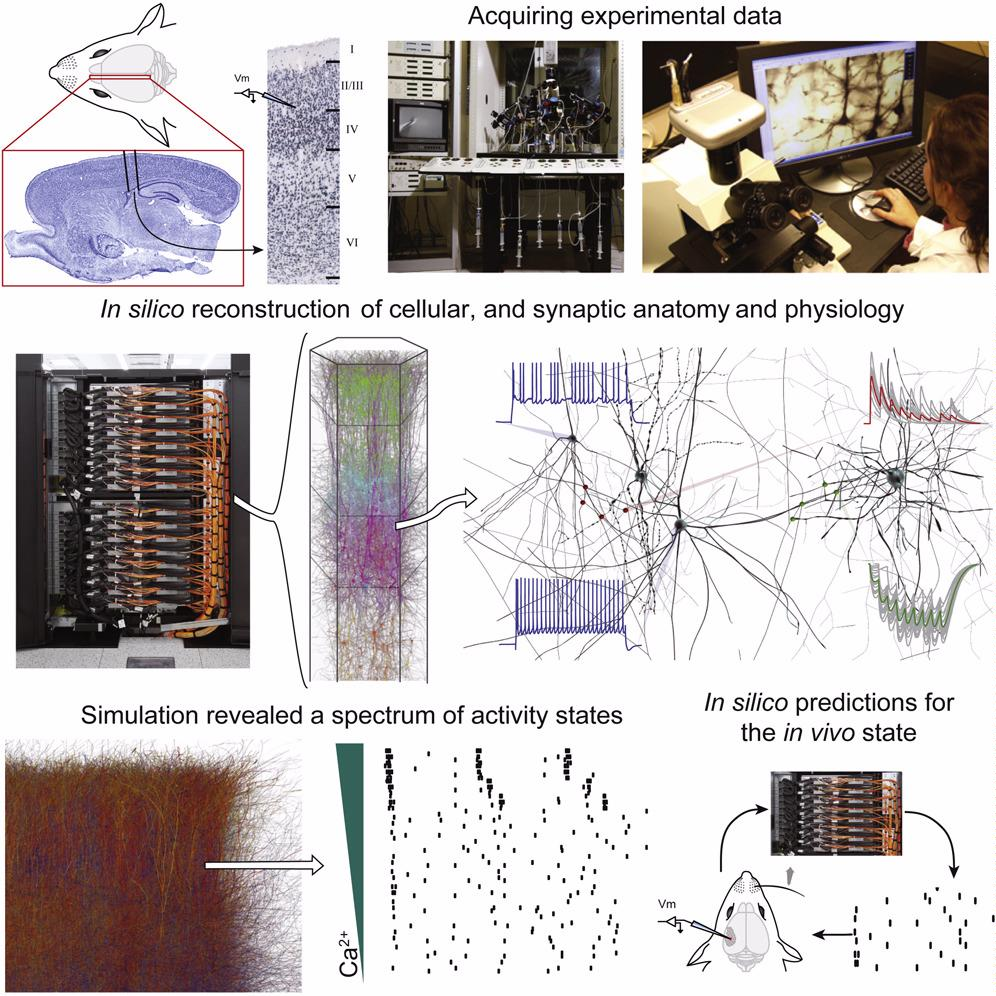
Blue Brain Project

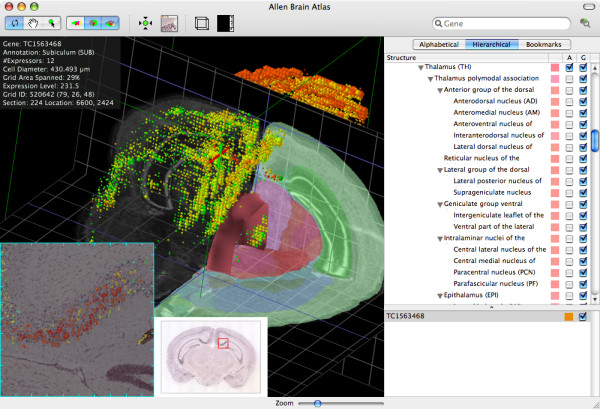
Maps the expression of EVERY gene in the entire brain
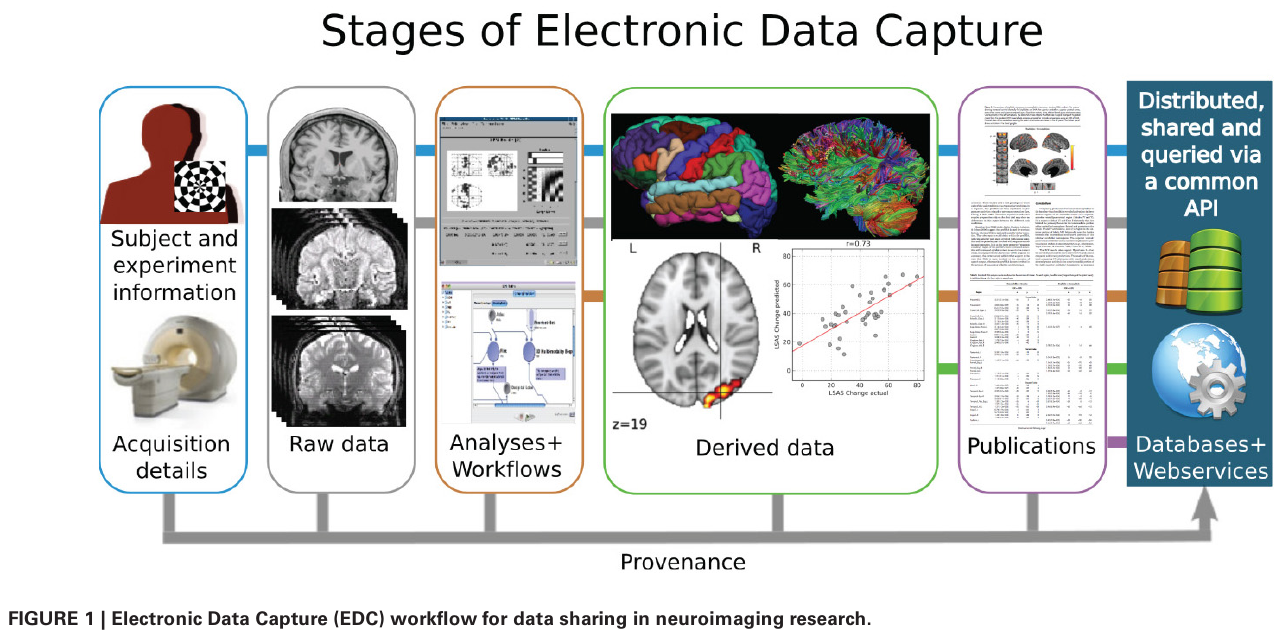
Requires data sharing, centralized repositories
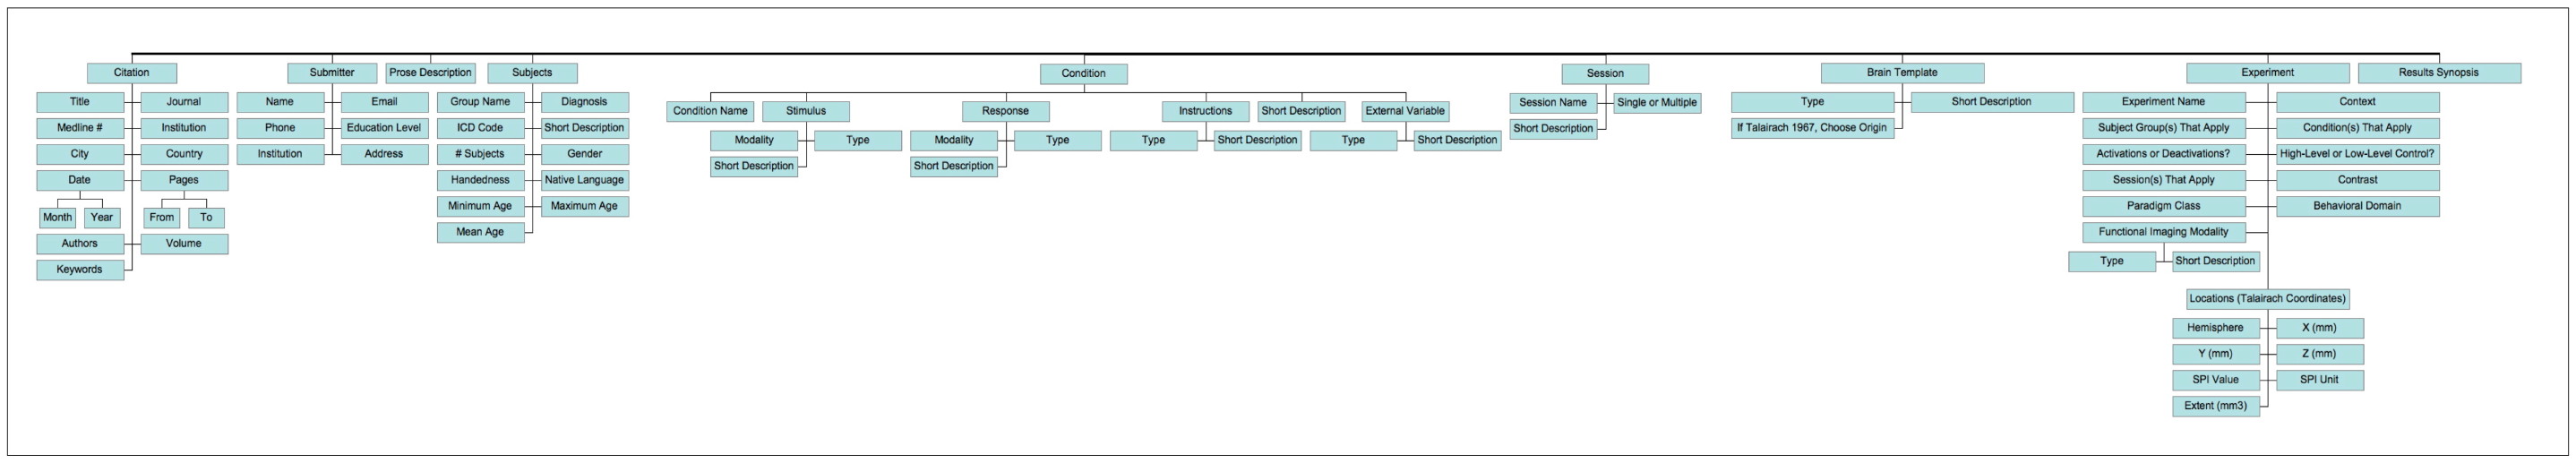
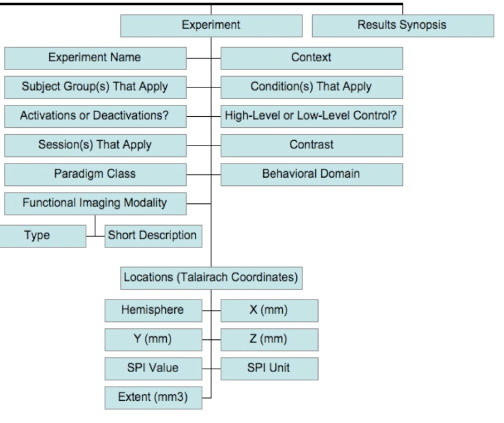
Formal ontology for neuroscience studies
Computability!
Neuroscience has a vast literature with data in multiple
levels/subfields.
Difficult to integrate these as a single researcher.
Computational models and multi-level complexity.

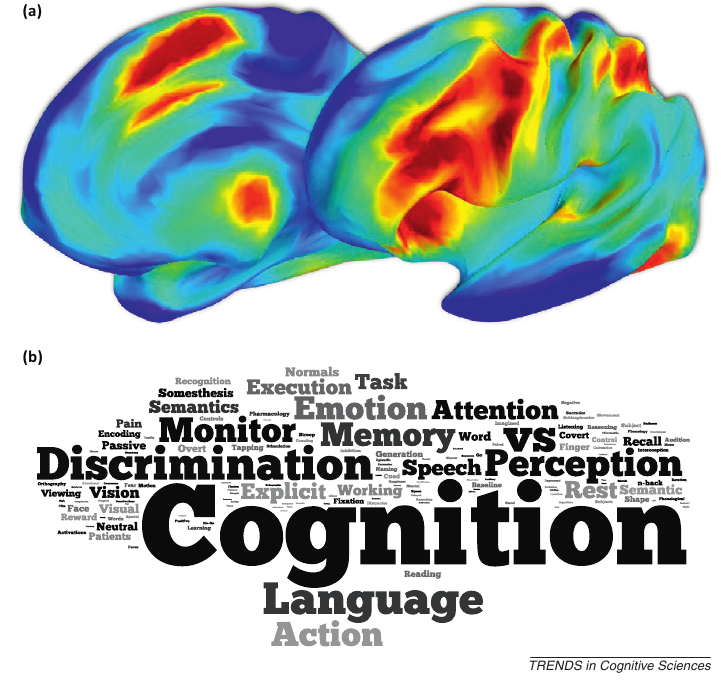
BrainMap: 20 years of formally coded fMRI studies in one database
Database of manually entered fMRI publications including activation
coordinates associated with experiments.
At the time of writing this, 19,921 experiments, 95,195 subjects.
Entered manually and high quality.
Research Imaging Institute of the University of Texas Health Science
Center San Antonio.
http://www.brainmap.org
Practical to deal with database (fMRI anywhere).
Reminder: activations
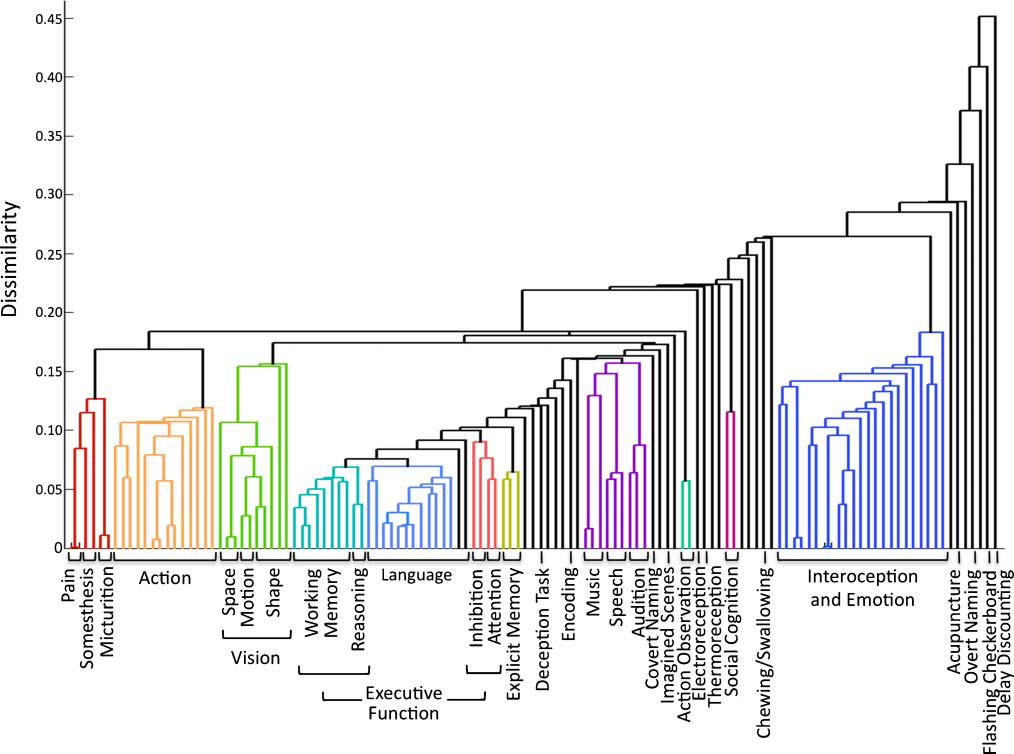
Representation in human cortex:
BrainMap hierarchical clustering of behavioral labels
by activation locations alone:
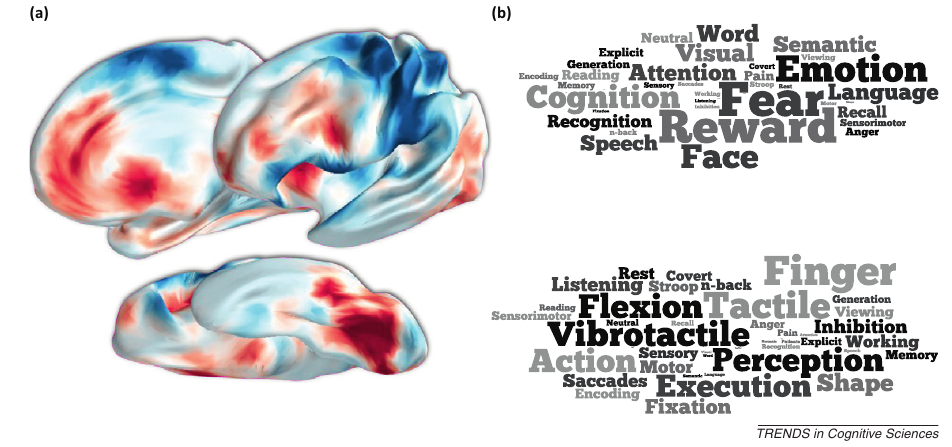
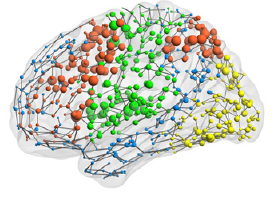
Functional networks in human cortex:
Functional activations (1000s of studies) versus functional connectivity
(1 study):
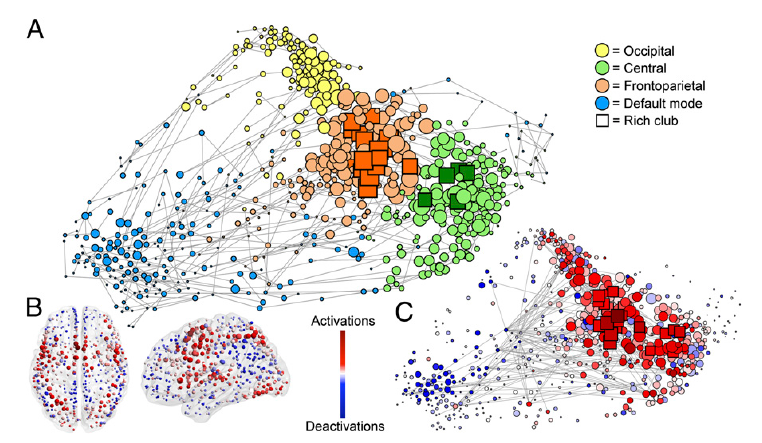
Side note:
diseases show increased prevalence at cortical network hubs,
including Alzheimers dementia, Aspergers syndrome, schizophrenia,
frontotemporal dementia, juvenile myoclonic epilepsy, progressive
supranuclear palsy, left and right temporal lobe epilepsy, and
post-traumatic stress disorder.
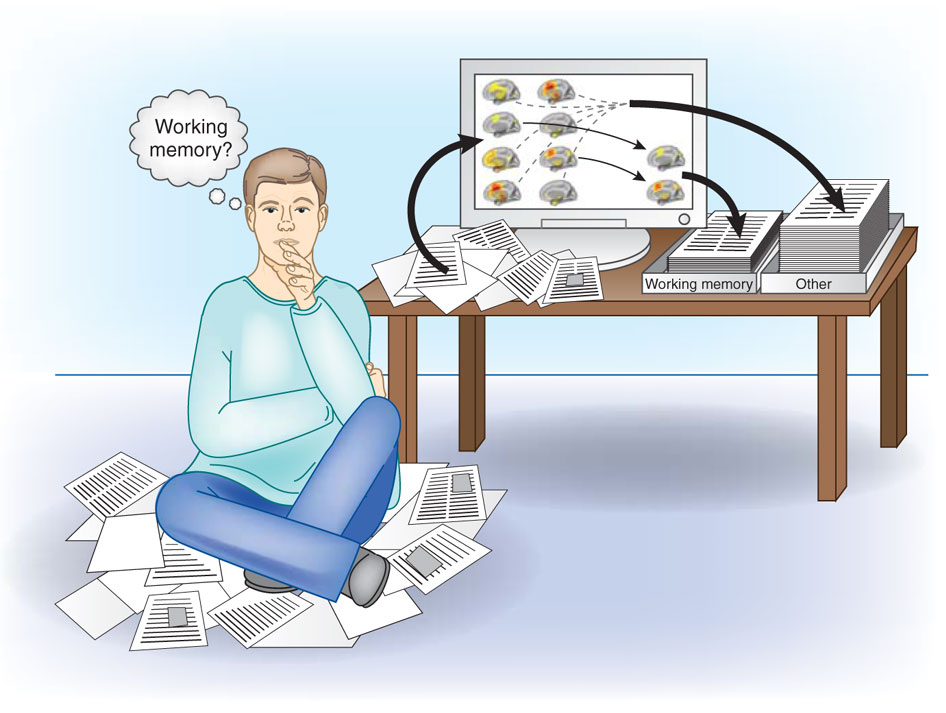
Automated fMRI databasing
Neurosynth platform (backend in Python)
auto-extracts tabular fMRI activation coordinates and word frequencies
from published studies:
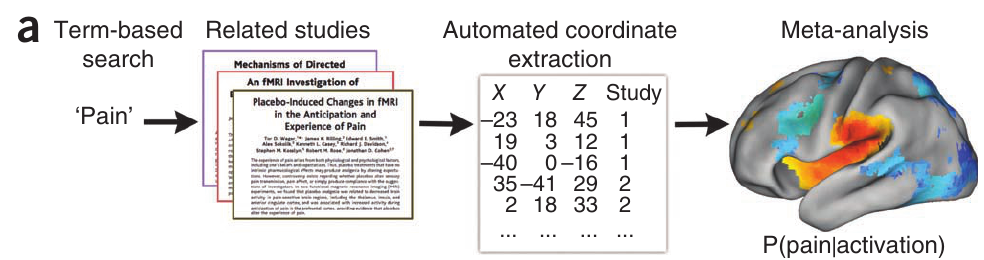
Set of features (words) for each study, labeling a linked set of
activation coordinates.
E.g., article may use the word “faces” at a greater frequency than
others
14,371 studies + their activations
University of Texas at Austin hosts at http://neurosynth.org/
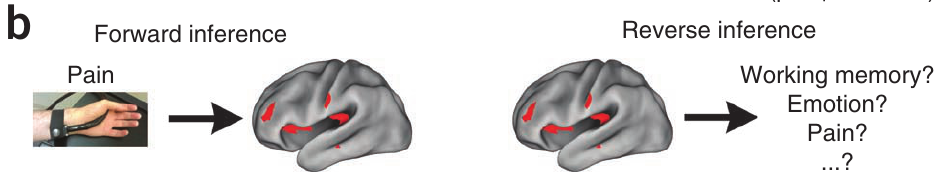
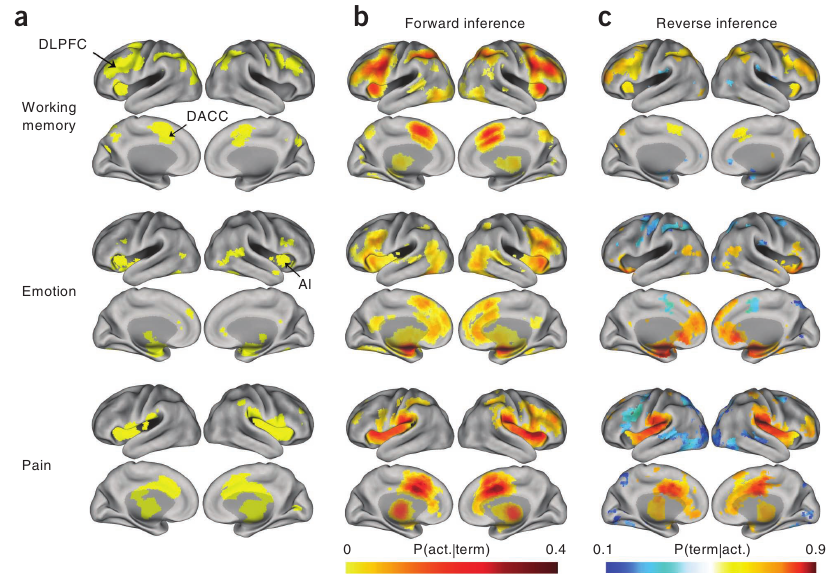
Representation in human cortex:
Forward inference maps show the probability of activation,
given the presence of the term, P(act.|term)
Reverse inference maps show the probability of the term,
given observed activation, P(term|act.)
Data analysis task:
Which word-activation associations in the neurosynth database best
spatially match your current brain state?
a.k.a. Mind-reading
Neurosynth: Mind reading task
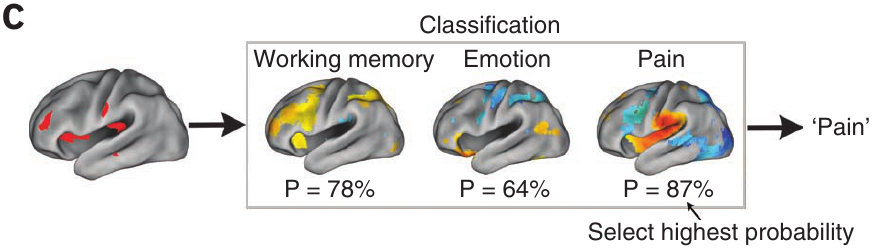
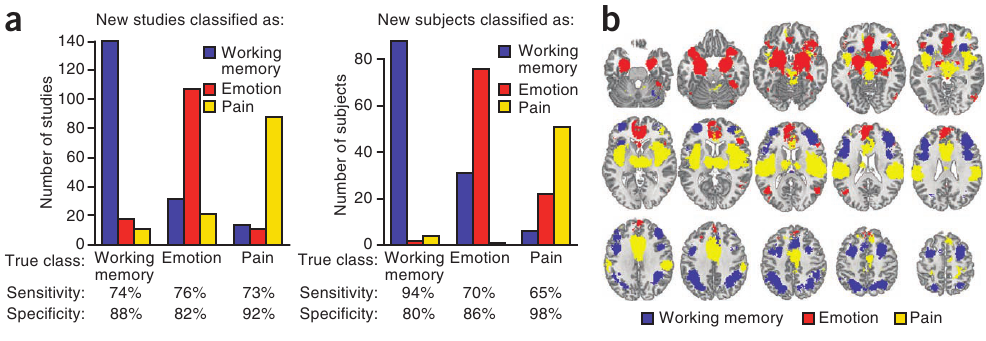
Classifiers:
General method we will cover in class – many very cool types!
This one is just a naive Bayes model.
Above chance (diagonals) for every category (i.e., success!)
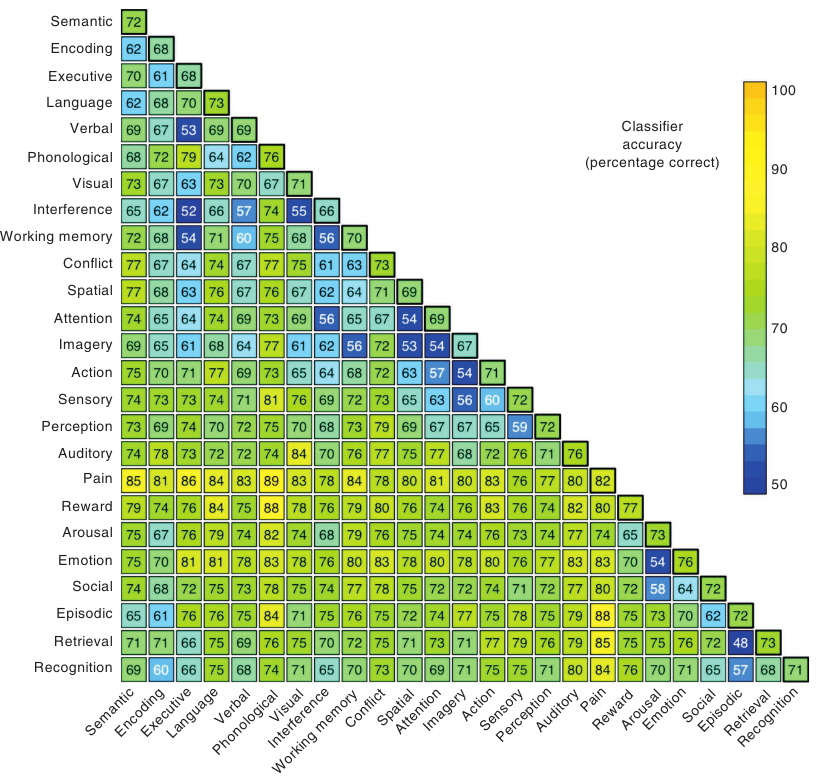
Validated by manual meta-analysis
How has the function of regions been studied?
Early studies
Lesions (accidental and otherwise).
Neurosurgery - lesion and direct stimulation.
PET studies.
fMEG, fMRI.
Modern neuroinformatics and computational neuroscience
Large databases of studies:
fMRI, MEG, DTI, rfMRI, gene expression, neuronal stucture, cellular
connectivity
Increases in power (n)
More robust to bias (not entirely)
Computable ontologies
Functional models as hypotheses and publications/literature
Improve the pace and reliability of science?
Traditional verbal hypothesis testing works, but it is slow,
and is somewhat limited to describing simpler systems.
Goal is to make this model-building process much more systematic:
Not 1 hypothesis, but at least 2, or better yet,
systematically refining a computational model
(e.g., bi-weekly model refinement based on empirical data).
The model is the knowledgebase,
and should be the unit of publication,
at least in many domains.