“I want the EA solve my problem…”
Different objectives imply different ways of designing and working with
an EA.
A good first step is to examine the given problem context.
We can roughly distinguish two main types of problems:
* design (one-off) problems
* repetitive problems
* including on-line control problems as special cases
3 Working with Evolutionary
Algorithms
Experiment design
Algorithm design
Test problems
Measurements and statistics
Some tips and summary
4 Experimentation
Has a goal or goals
Involves algorithm design and implementation
Needs problem(s) to run the algorithm(s) on
Amounts to running the algorithm(s) on the
problem(s)
Delivers measurement data, the results
Is concluded with evaluating the results in the
light of the given goal(s)
Is often documented
4.1 Various overlapping goals
Get a good solution for a given problem
Show that EC is applicable in a (new) problem domain
Show that my_EA is better than benchmark_EA
Show that EAs outperform traditional algorithms
Find best setup for parameters of a given algorithm
Understand algorithm behavior (e.g., pop dynamics)
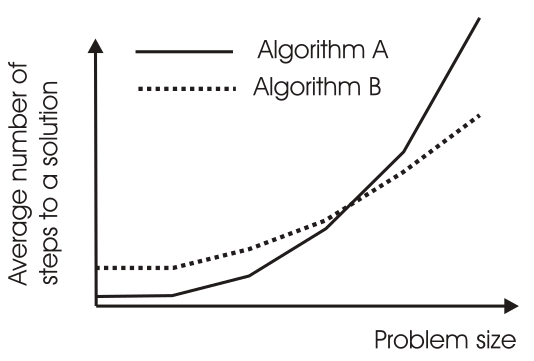
See how an EA scales-up with problem size
See how performance is influenced by parameters
…
5 Example: Production
Perspective
Logistics: Optimizing delivery routes.
* Different destinations each day
* Limited time to run algorithm each day
* Must always be reasonably good route in limited
time
6 Example: Design Perspective
Optimizing spending on improvements to national road network
Total cost: billions of Euros
Computing costs relatively negligible
Six months to run algorithm on hundreds computers
Many runs possible
Must produce very good result just once
7 Perspectives of goals
Design perspective:
find a very good solution at least once
Production perspective:
find a good solution at almost every run
Publication perspective:
must meet scientific standards (heh?)
Application perspective:
good enough is good enough (verification!)
These perspectives have very different implications on evaluating the
results.
However, the are often left implicit…
8 Algorithm design
Design a representation
Design a way of mapping a genotype to a phenotype
Design a way of evaluating an individual
Select individuals
Decide how to select individuals to be parents
Decide how to select individuals for the next generation (how to manage
the population )
Instantiate
Decide how to start: initialization method
Decide how to stop: termination criterion
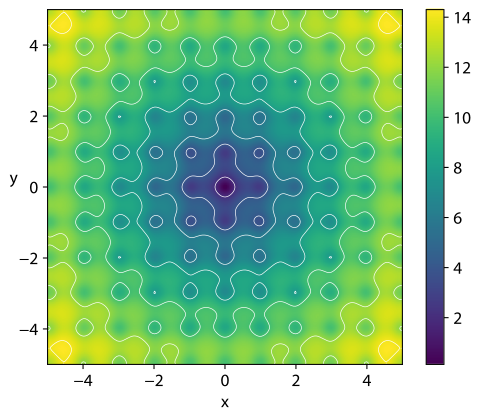
9 Test problems
One can generalize many representations to numerical.
In assuming this unified representation space,
we can define purely numerical lanscapes with different shapes.
5 DeJong functions
25 “hard” objective functions
Frequently encountered or otherwise important variants of given
practical problem
Selection from recognized benchmark problem repository
(“challenging” by being NP— ?!)
Problem instances made by random generator
Choice has severe implications on
generalizability and
scope of the results
10 Bad example
I invented “tricky mutation”
Showed that it is a good idea by:
Running standard (?) GA and tricky GA
On 10 objective functions from the literature
Finding tricky GA better on 7, equal on 1, worse on 2 cases
I wrote it down in a paper
And it got published!
What did I learn from this experience?
Is this good work?
What did I (my readers) not learn:
* How relevant are these results (test functions)?
* What is the scope of claims about the superiority of the tricky
GA?
* Is there a property distinguishing the 7 good and the 2 bad
functions?
* Are my results generalizable? (Is the tricky GA applicable for other
problems? Which ones?)
11 Getting Problem Instances
11.1 Testing on real data
Advantages:
Results could be considered as very relevant viewed from the
application domain (data supplier)
Disadvantages
Can be over-complicated
Can be few available sets of real data
May be commercial sensitive – difficult to publish and to allow
others to compare
Results are hard to generalize
11.2 Standard data sets in problem
repositories, e.g.:
can produce many instances with the same characteristics
enable gradual traversal of a range of characteristics
(hardness)
Can be shared allowing comparisons with other researchers
Disadvantage
Not real – might miss crucial aspect
Given generator might have hidden bias
12 Basic rules of
experimentation
EAs are stochastic, so don’t rely on conclusions from a single run
perform sufficient number of independent runs
use statistical measures (averages, standard deviations)
use statistical tests to assess reliability of conclusions
EA experimentation is about comparison, so always do a fair
competition
use the same amount of resources for the competitors
try different computational limits (to coop with turtle/hare
effect)
use the same performance measures
13 Things to Measure
Many different ways to measure, for example:
* Average result in given time
* Average time for given result
* Proportion of runs within % of target
* Best result over n runs
* Amount of computing required to reach target in given time with %
confidence
* …
14 What time units do we use?
Elapsed time?
Depends on computer, network, etc…
CPU Time?
Depends on skill of programmer, implementation, etc…
Generations?
Difficult to compare when parameters like population size
change
Evaluations?
Evaluation time could depend on algorithm, e.g. direct vs. indirect
representation
15 Measures
Performance measures (off-line)
* Efficiency (alg. speed)
* CPU time
* No. of steps, i.e., generated points in the search space
* Effectivity (alg. quality)
* Success rate
* Solution quality at termination
“Working” measures (on-line)
* Population distribution (genotypic)
* Fitness distribution (phenotypic)
* Improvements per time unit or per genetic operator
* …
16 Performance measures
Number of of generated points in the search space = number of of
fitness evaluations
(don’t use no. of generations!)
AES: average number of evaluations to solution
SR: success rate = % of runs finding a solution
(individual with acceptabe quality / fitness)
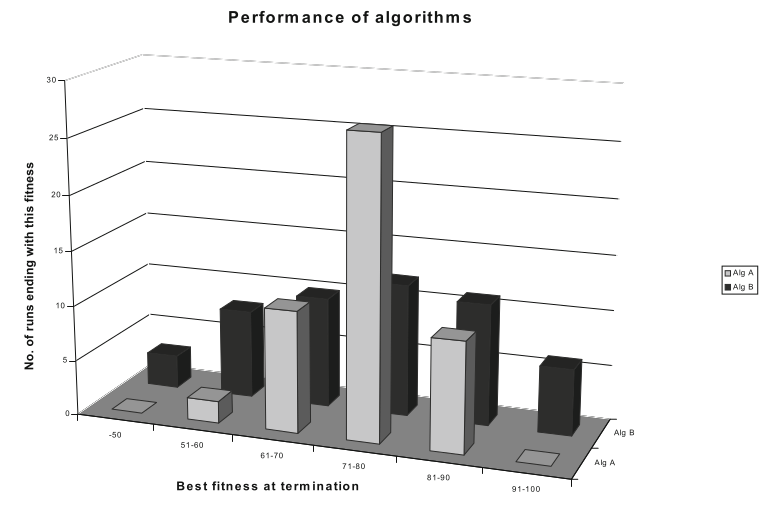
MBF: mean best fitness at termination, i.e., best
per run, mean over a set of runs
SR ≠ MBF
Low SR, high MBF: good approximizer (more time helps?)
High SR, low MBF: “Murphy” algorithm
17 Fair experiments
Basic rule: use the same computational limit for each
competitor
Allow each EA the same no. of evaluations, but
Beware of hidden labour, e.g. in heuristic mutation operators
Beware of possibly fewer evaluations by smart operators
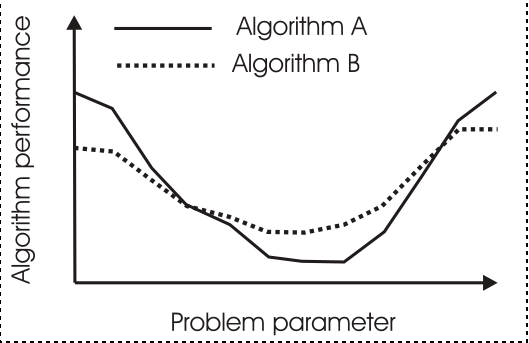
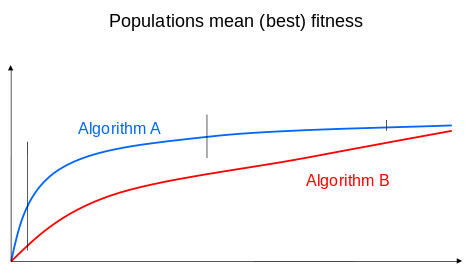
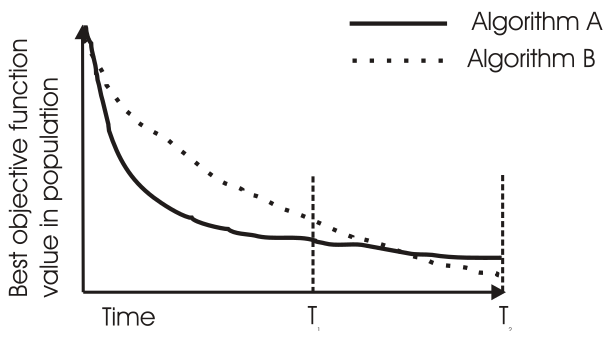
Comparing algorithms A and B by after terminating at time T1 and T2 (for
a minimisation problem).
Algorithm A clearly wins in the first case, while B is better in the
second one
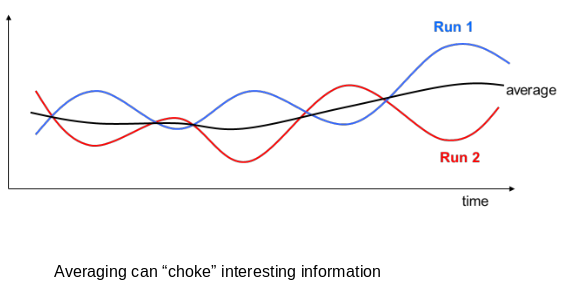
20 Example: averaging on-line
measures
Averaging can “choke” or filter out interesting information
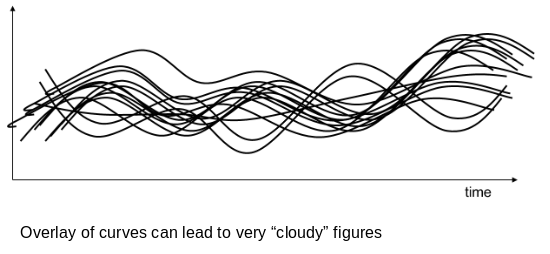
21 Example: overlaying on-line
measures
Overlay of curves can lead to very “cloudy” figures
Best: show continuous mean, sem, STD over x axis, plus various
randomized controls!
Like the supplementary figures in this paper of mine: https://www.nature.com/articles/srep18112
22 Statistical Comparisons and
Significance
Algorithms are stochastic, results have element of “luck”
If a claim is made “Mutilation A is better than mutation B”, need to
show statistical significance of comparisons
Fundamental problem: two series of samples (random drawings) from
the SAME distribution may have DIFFERENT averages and standard
deviations
Tests can show if the differences are significant or not
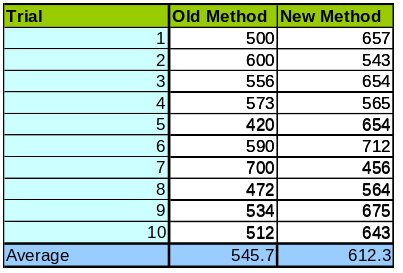
23 Example
Is the new method better?
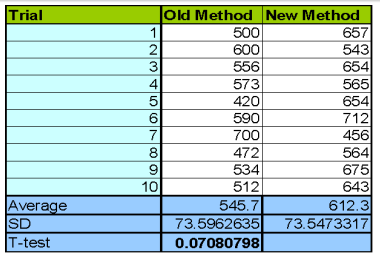
24 Example (cont’d)
Standard deviations supply additional info
T-test (and alike) indicate the chance that the values came from the
same underlying distribution (difference is due to random effects) E.g.
with 7% chance in this example.
You’re better off with visualizations and distributions…
25 Statistical tests
Start with descriptive plots.
If you must resort to statistics, do so only after fully exploring
descriptive plots, distributions, and raw data!
T-test assummes:
Data taken from continuous interval or close approximation
Normal distribution
Similar variances for too few data points
Similar sized groups of data points
Other tests:
Wilcoxon - preferred to t-test where numbers are small or
distribution is not known.
F-test - tests if two samples have different variances.
26 Better example: problem
setting
I invented myEA for problem X
Looked and found 3 other EAs and a traditional benchmark heuristic
for problem X in the literature
Asked myself when and why is myEA better
27 Better example: experiments
Found/made problem instance generator for problem X with 2
parameters:
n (problem size)
k (some problem specific indicator)
Selected 5 values for k and 5 values for n
Generated 100 problem instances for all combinations
Executed all alg’s on each instance 100 times (benchmark was also
stochastic)
Recorded AES, SR, MBF values w/ same comp. limit
(AES for benchmark?)
Put my program code and the instances on the Web
28 Better example: evaluation
Arranged results “in 3D” (n, k) + performance
(with special attention to the effect of n , as for
scale-up)
Assessed statistical significance of results
Found the niche for my_EA:
Weak in … cases, strong in … cases, comparable otherwise
Thereby I answered the “when question”
Analyzed the specific features and the niches of each algorithm thus
answering the “why question”
Learned a lot about problem X and its solvers
Achieved generalizable results, or at least claims with
well-identified scope based on solid data
Facilitated reproducing my results, so further research
29 Some tips
Be organized
Decide what you want & define appropriate measures
Choose test problems carefully
Make an experiment plan (estimate time when possible)
Perform sufficient number of runs
Keep all experimental data (never throw away anything)
Use good statistics (“standard” tools from Web, MS, R)
Present results well (figures, graphs, tables, …)
Watch the scope of your claims
Aim at generalizable results
Publish code for reproducibility of results (if applicable)
Publish data for external validation (open science)