from machine code to design,
and everything in between:
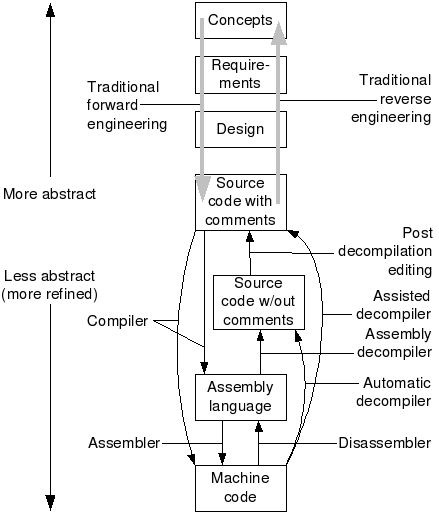
“I would love to change the world,
but they won’t give me the source code.”
- Ed Jorgensen (the book below)
Documentary: Zero Days (StuxnNet expose video)
https://www.youtube.com/watch?v=OoLCI2obpYI
https://duckduckgo.com/?q=watch+zero+days+online+free
(if you want better subtitles, search around…)
In thinking about the Zero Days documentary we watched,
here is a funny coincidental current event:
https://www.theregister.com/2022/10/24/black_reward_iran_nuclear_leak/
And, if you found these national security topics valuable or fun to
think about:
https://www.amazon.com/Future-Violence-Robots-Hackers-Confronting/dp/0465089747
document.querySelector('video').playbackRate = 1.2In general, most resources on the internet on learning assembly are
out-of-date,
using 32bit, or older architectures.
I have compiled this entire document with a focus on modern
x86-64asm,
on the Linux platform.
Though Linux uses AT&T syntax primarily,
Intel is still compatible with the GNU stack,
and other Linux systems,
as well as being the primary Windows syntax;
they are also trivially convertible.
Thus, though we use Linux for the examples,
I still use Intel Syntax primarily throughout this document,
for wider applicability and cross-platform knowledge
(at essentially no cost to understanding open platforms).
Code demos: ReverseEngineering/asm_demos.tar.xz
The primary resource besides this page that you will use is:
http://www.egr.unlv.edu/~ed/assembly64.pdf (latest
here)
ReverseEngineering/assembly64.pdf
(my local copy which may be out of date)
This book is quite readable, beginner friendly, and has lots of good
examples.
I do expect that you read the following chapters,
in full detail before this section’s assignment.
It may take 5+ hours, so keep up,
and do it in smaller chunks for pleasantness and
retention!
Critical chapters
1-3 - Background and intro (skim)
4 - Program format (important)
5 - Tool chain (important)
7 - Instruction set overview (important)
8 - Addressing modes (important)
9 - Process stack (important)
11 - Macros (skim)
12 - Functions (calling convention is a must-know!)
13 - System services (skim)
15 - Stack buffer overflow (important)
I also suggest watching this well-done full video series from
SecurityTube:
https://www.youtube.com/watch?v=K0g-twyhmQ4&list=PLyqno_bgl3e-zLBZGdi_zsPQYPQUlZYe4&index
From design to machine code,
from machine code to design,
and everything in between:

There are two components of reverse engineering:
Re-documentation
Re-creation of new representation of existing source code,
so that it is easier to understand.
Source code is already available for software,
but higher-level aspects of the program,
are perhaps poorly documented,
or documented, but no longer valid.
The first thing you do at your first summer internship…?
Design recovery
Using deduction or reasoning from general knowledge,
personal experience of the product,
or binary code,
in order to fully understand the product functionality.
There is no source code available for the software.
Discover (or write) what could be possible source code for the
software.
This second usage of the term is the one most people are familiar
with.
Reverse engineering of software can make use of the clean room design
technique,
to avoid copyright infringement
(if one cares about that particular arbitrary legal construct).
Software is not verifiably secure unless code is
fully evaluated.
To evaluate potential or known malware or
spyware.
To find or evaluate vulnerabilities (either intentional
or not) in any software.
To build software to interoperate with a proprietary
binary, without having source code.
To build interoperating software, potentially without a binary or source
code, at the protocol or API level.
To crack DRM of many kinds.
To cheat game software.
To develop exploits of available binaries.
To learn the inner-workings of compilation and
execution better!
To steal already trained machine learning models.
https://www.reactos.org/
The ReactOS project is even more ambitious in its goals.
It strives to provide binary (ABI and API) compatibility,
with the current Windows OS’es of the NT branch,
allowing software and drivers written for Windows,
to run on a clean-room reverse-engineered Free Software (GPL)
counterpart.
https://www.libreoffice.org/
LibreOffice and OpenOffice do this for the Microsoft Office file
formats.
https://www.samba.org/
Allows systems that are not running Microsoft Windows systems,
to share files with systems that are.
It is a classic example of software reverse engineering,
since the Samba project had to reverse-engineer unpublished
information,
about how Windows file sharing worked,
so that non-Windows computers could emulate it.
https://www.winehq.org/
The Wine project does the same thing for the Windows API,
and OpenOffice.org is one party doing this for the Microsoft Office file
formats.
http://www.windowsscope.com/
Allows for reverse-engineering the full contents of a Windows system’s
live memory,
including a binary-level, graphical reverse engineering of all running
processes.
+++++++++++++++++++++
Cahoot-13b.1
Consider the above software products
Reverse engineering of software can be accomplished by various
methods.
The three main groups of software reverse engineering are:
Analysis through observation of information
exchange
Most prevalent in protocol reverse engineering,
which involves using bus analyzers and packet sniffers,
for example, for accessing a computer bus or computer network
connection,
and revealing the traffic data.
Bus or network behavior can then be analyzed,
to produce a stand-alone implementation that mimics that behavior.
This is especially useful for reverse engineering device drivers and
network protocols.
Disassembly using a disassembler
The raw machine language of the program is read and understood in its
own terms,
only with the aid of machine-language mnemonics.
This works on any computer program,
but can take extensive effort and human time,
especially for someone not used to machine code.
A disassembler translates an executable program into assembly
language.
Translate machine language into assembly language,
the inverse operation to that of an assembler.
A disassembler differs from a de-compiler,
which targets a high-level language rather than an assembly
language.
Disassembly, the output of a disassembler,
is often formatted for human-readability,
rather than suitability for input to an assembler,
making it principally a reverse-engineering tool.
Decompilation using a decompiler
A process that tries, with varying degree of success,
to recreate the source code in some high-level language,
from a program only available in machine code or bytecode.
Translate executable programs (the output from a compiler),
into source code in a (relatively) high level language,
which when compiled, will produce an executable,
whose behavior is the same as the original executable program.
Protocols are sets of rules that describe:
message formats,
how messages are exchanged,
and how state changes as a result
(i.e., the protocol finite state-machine).
Protocol reverse-engineering can be partitioned into two
sub-problems
(the parts of any protocol):
1. message format and
2. state-machine reverse-engineering.
Message formats
have traditionally been reverse-engineered through a tedious manual
process,
which involved analysis of how protocol implementations process
messages,
but recent research proposed a number of automatic solutions.
Typically, these automatic approaches either:
group observed messages into clusters using various clustering analyses,
or
emulate the protocol implementation, tracing the message processing.
There has been less work on reverse-engineering of
state-machines of protocols.
In general, the protocol state-machines can be learned either
through:
a process of offline learning,
which passively observes communication,
and attempts to build the most general state-machine,
congruent with all observed sequences of messages, and
or online learning,
which allows interactive generation of probing sequences of
messages
and listening to responses to those probing sequences.
Example tools for network protocol reversing
#!/bin/bash

# for reversing a network protocol
wireshark

# (or obsolete netstat)
# to check for network connections matching PID
# Let's say we are trying to reverse engineer a program that
# uses some network communication.
# A quick look at what netstat displays can give us clues
# where the program connects, and after some investigation
# maybe why it connects to this host.
# netstat does not only show TCP/IP connections,
# but also UNIX domain socket connections which are used in
# interprocess communication in lots of programs.
# netstat is deprecated for ss
ss
netstat # obsoleted by ss, which is the better modern optionIn ReverseEngineering/asm_demos.tar.xz
simple-main.cpp linked to
qtcreator/simple-main/main.cpp
// This is a basic C++ program
#include <iostream>
using std::cin;
using std::cout;
using std::endl;

int main() {
  char cstring[14] = "Hello, world!";
  cout << cstring << endl;
  cin >> cstring;
  cout << cstring;

  return 0;
}
Assuming simple-main.cpp above
#!/bin/bash

# Assuming a C/C++ binary, a.out

# Linux ignores extensions and looks at the actual file contents
g++ -g simple-main.cpp
file a.out

# ldd is a basic utility that shows us what libraries a program
# is linked against, or if its statically linked.
# It also gives us the addresses that these libraries are mapped
# into the program's execution space, which can be handy for
# following function calls in disassembled output
ldd a.out

# nm lists all of the local and library functions, global
# variables, and their addresses in the binary.
# However, it will not work on binaries that have been stripped
# with strip.
nm a.out

# to watch open files
# lsof is a program that lists all open files by the processes
# running on a system.
# An open file may be a regular file, a directory, a block
# special file, a character special file,
# an executing text reference, a library, a stream or a network
# file (Internet socket, NFS file or UNIX domain socket).
# It has plenty of options, but in its default mode it gives an
# extensive listing of the opened files.
lsof

# simple example:
# does another program have your password database open?
echo correcthorsebatterystaple >mypasswords.txt
vim mypasswords.txt
lsof | grep mypasswords.txt
# Notice that you see the file is open!
# If a.out had opened the file, it would have shown that.

# For example, to grab a video file of a Flash video you
# just streamed in your browser, but your browser is hiding from you
lsof | grep Flash
lsof | grep flash
lsof | grep html5
# or whatever other keyword may be appropriate
# show with open file

# This utility can be quite useful in evaluating a binary
# It traces all library calls made by a program.
# Useful options:
#    -S (display syscalls too)
#    -f (follow fork)
#    -o filename (output trace to filename)
#    -C (demangle C++ function call names)
#    -n 2 (indent each nested call 2 spaces)
#    -i (prints instruction pointer of caller)
#g    -p pid (attaches to specified pid)
ltrace ./a.out

#  trace system calls a program makes as it makes them.
# Useful options:
#    -f (follow fork)
#    -ffo filename (output trace to filename.pid for forking)
#    -i (Print instruction pointer for each system call)
strace ./a.out

# list of system calls, x86-64
# (their requirements for register usage are elsewhere)
vim /usr/include/asm/unistd_64.h
# show exit, for example

# to find PID
# Show with a.out waiting on input, open program
ps -aux | grep yourexename

# For example:
./a.out
# which waits on input (and this is still running)
ps -aux | grep a.out
# find PID of above process, then

# the stack memory layout
vim /proc/PIDofInterest/maps
# show with example above

# hexdump
hexdump a.out
hexdump a.out | less

# nicer annotated view
hexdump -Cv a.out
# or
hexdump -Cv a.out | less
# or
hexdump -Cv a.out >aout_hexdump
vim aout_hexdump
# Note: editing this dumped file is
# not the same as editing the binary as below!

# Alt to hexdum
xxd a.out | less

# show finding /Hello in file, editing it
# Some hex editors
ghex a.out  # nice
# Edit the 'H'
./a.out

# Some other hex editors
bless
hte
hexedit
dhex

vim a.out
# :%!xxd to switch into hex mode
# :%!xxd -r to exit from hex mod

# to print all strings in binary
strings a.out | less
strings a.out | grep ello

readelf -a a.out | less
# or
readelf -a a.out >aout_readelf
vim aout_readelf

# print disassembly
objdump -d a.out | less
# or with syntax highlighting
objdump -d a.out >aout_objdump.s
vim aout_objdump.s

objdump -M intel -d a.out | less
# or with syntax highlighting
objdump -M intel -d a.out >aout_objdump.asm
vim aout_objdump.asm

# comes with nasm, more detailed
ndisasm a.out | less
# or with syntax highlighting
ndisasm a.out >aout_ndisasm.asm
vim aout_ndisasm.asm

# debuggers below: can debug with source, with binary only,
# or even attach to a running process

gdb a.out # layout asm or tui enable
# > info sharedlibrary
# > disassemble main
# > disassemble yourfuncname
# > layout next
# > set disassembly-flavor intel
# > start, step, next, stepi, nexti

# graphical debugger that just grabs the binary and source
# in the same directory. OK, not as nice as qtcreator
kdbg a.out

# graphical debuggers that you have to run/compile in

# used for large systems programming projects,
# very full featured.
kdevelop

# used for large gui projects, etc., nice, best of the C++ debuggers
qtcreatorgdb at the command line.gdb,
there are a number of ways to do so, including:Hint:
The 2nd how-to just above is very helpful for your upcoming
project,
where you will want to trace random binaries I give you!
Alternatively, this command line gdb tweak is really nice:
https://github.com/cyrus-and/gdb-dashboard
See:
>>> help dashboard
To toggle a section:
>>> dashboard stack
Alternative way to set seciton views:
>>> help dashboard -layout
>>> dashboard -layout
>>> dashboard -layout stack assembly registers memory source variables
To see the stack directly:
General form:
>>> dashboard memory watch <address> <length of memory to watch, in bytes>
Example watching regions around the base pointer and stack
pointer:
>>> dashboard memory watch $rbp-64 72
>>> dashboard memory watch $rsp 64
Recall what direction the stack and heap are addressed.
>>> dashboard memory clear
Of a specific variable:
>>> p &your_var
or:
>>> info address your_var
then:
>>> dashboard memory watch <whatever address printed> <size>
GDB command history is stored in the folder it was run in.
./gdb_history
+++++++++++++++++++++
Cahoot-13b.2
Debuggers?
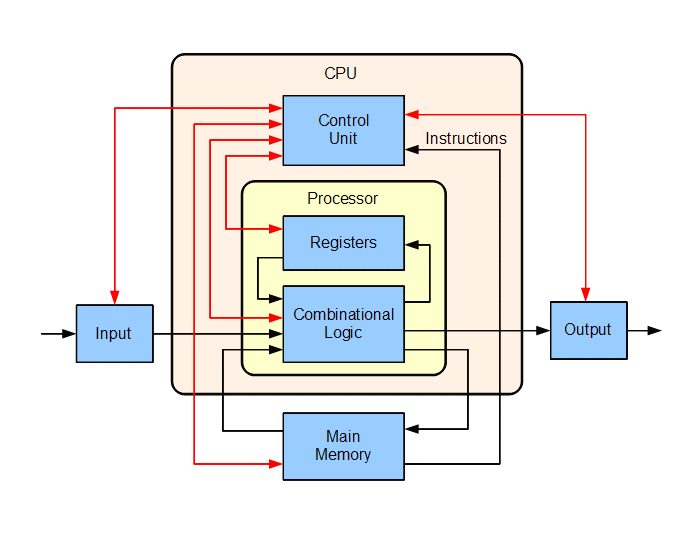
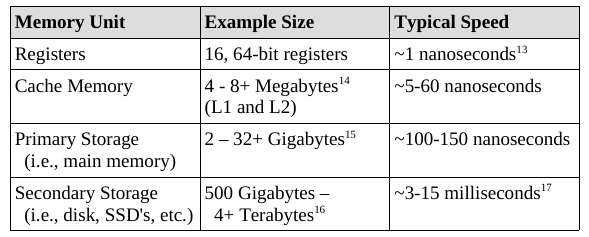
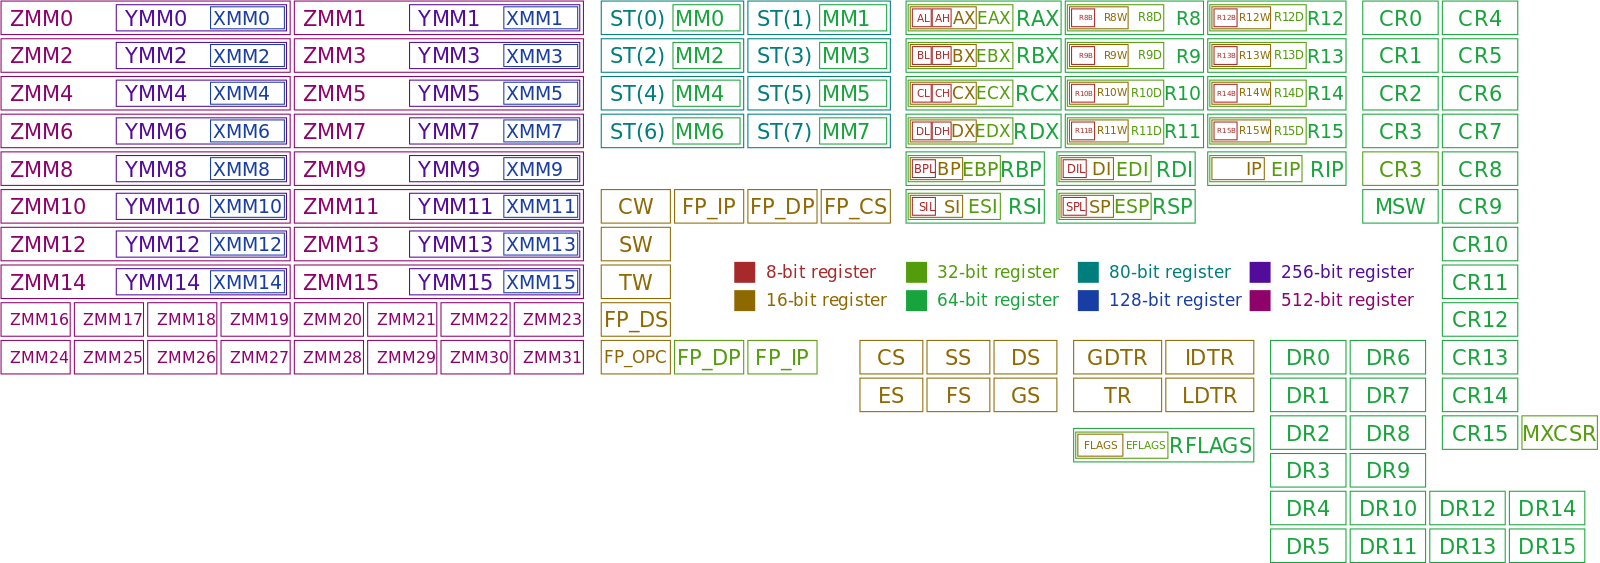
A processor register is a quickly accessible storage
location,
available to a computer’s central processing unit (CPU).
Registers usually consist of a small amount of
fast storage,
although some registers have specific hardware functions,
and may be read-only or write-only.
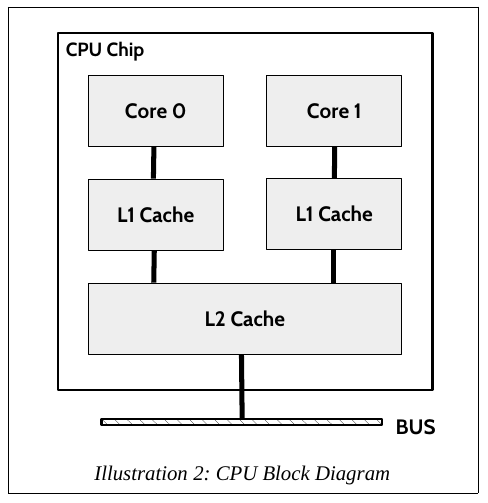
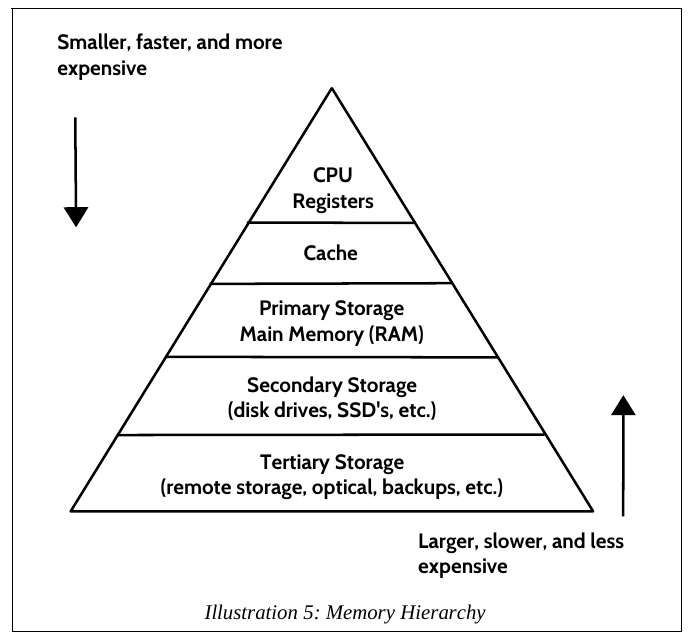
For example, on x86-64:

With a slighly different depiction:
+++++++++++++++++++++
Cahoot-13b.3
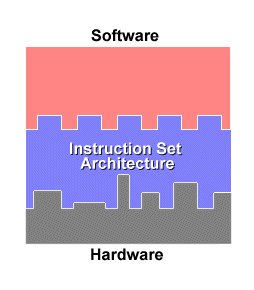
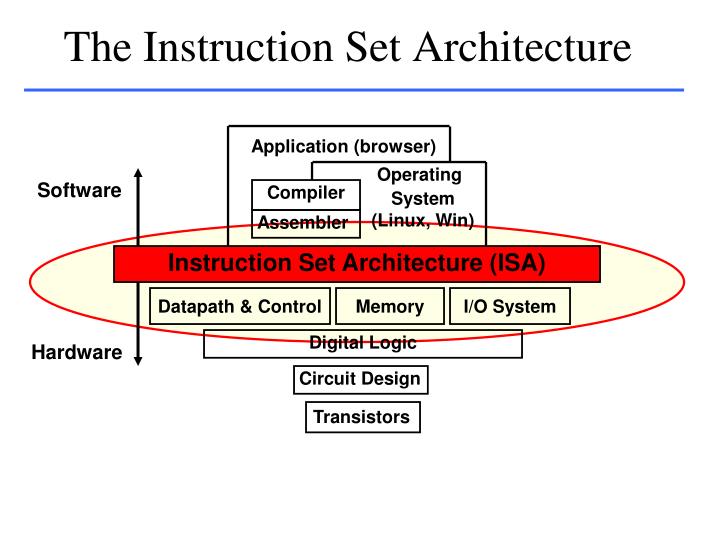
An ISA defines everything a machine language programmer needs to know in order to program a computer.
What defines an ISA, and what differs between ISAs?
In general, ISAs define:
the supported data types,
what state there is (such as the main memory and
registers),
their semantics (such as the memory consistency and
addressing modes),
the instruction set (the set of machine instructions
that comprises machine language),
and the input/output model.
Machine language is built up from discrete statements
or instructions.
On a processing architecture, a given instruction may specify:
1. particular registers for arithmetic, addressing, or control
functions
2. particular memory locations or offsets
3. particular addressing modes used to interpret the operands
More complex operations are built up by combining these simple
instructions,
which are executed sequentially,
or as otherwise directed by control flow instructions.
Examples of operations common to many instruction sets include:
Data handling and memory operations
Arithmetic and logic operations
Control flow operations
Co-processor instructions
Complex instructions
“Levels” of instruction:
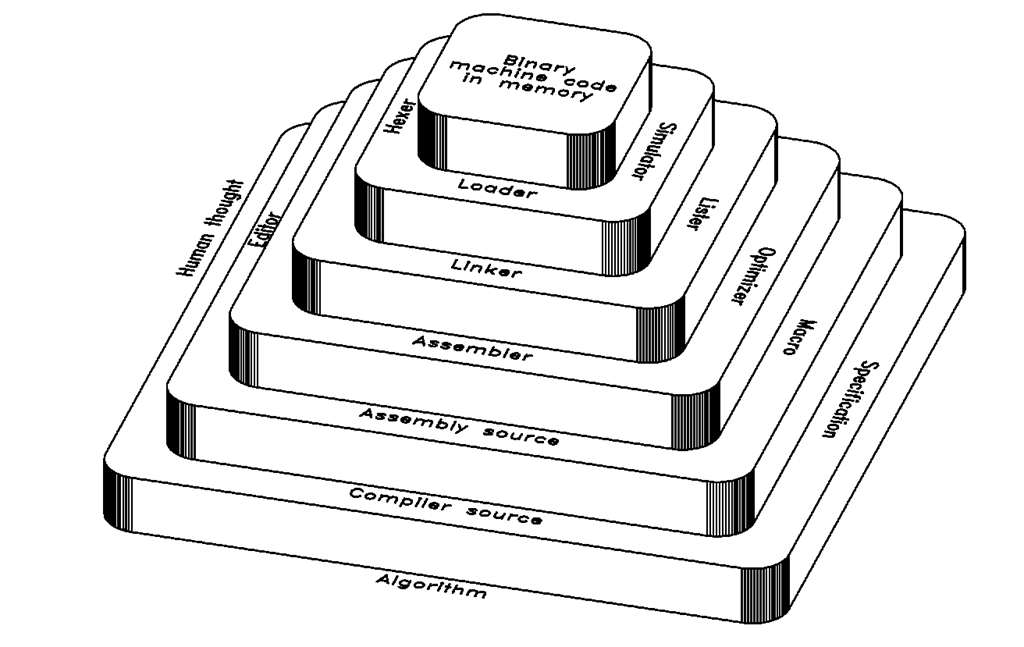
1) Compile source to assembly
2) assemble and link to produce machine code
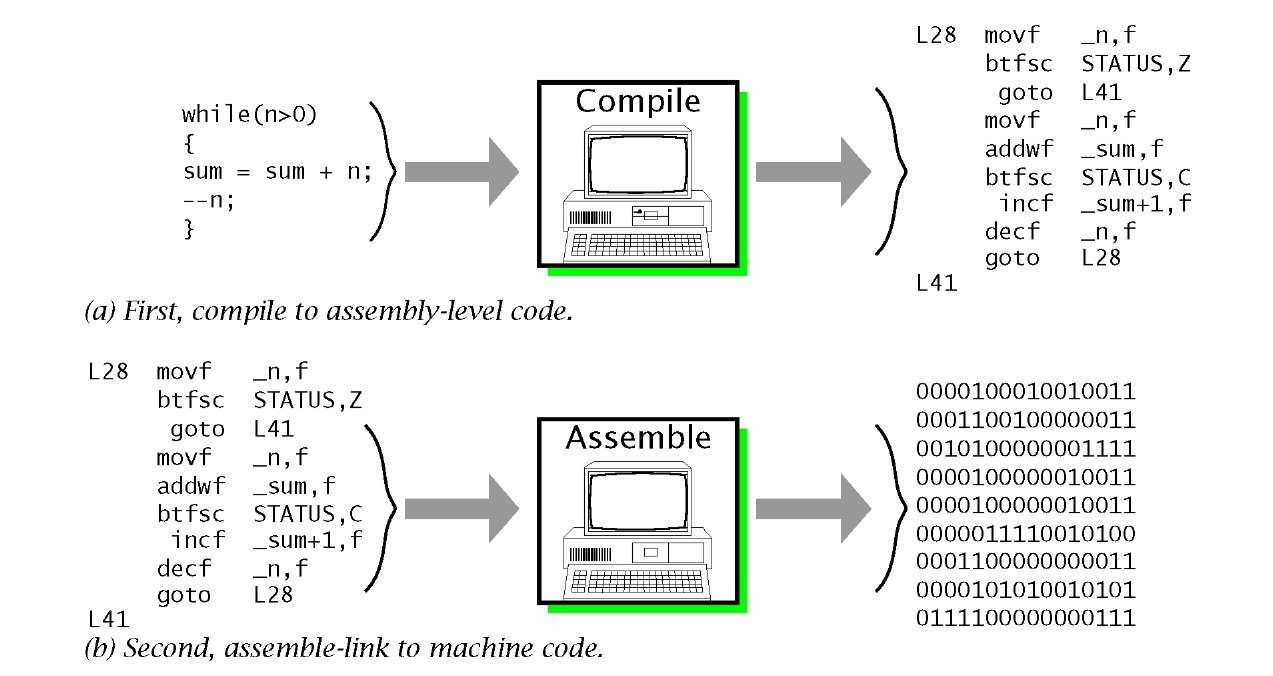
The first step is a significant translation,
the other is a more rote aliasing.
Next, a more detailed overview of step 2) above
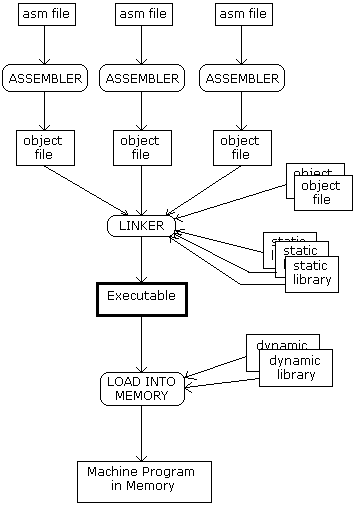
Dynamic libraries are common targets of malware.
Given the above figure, why?
How do you load the program?
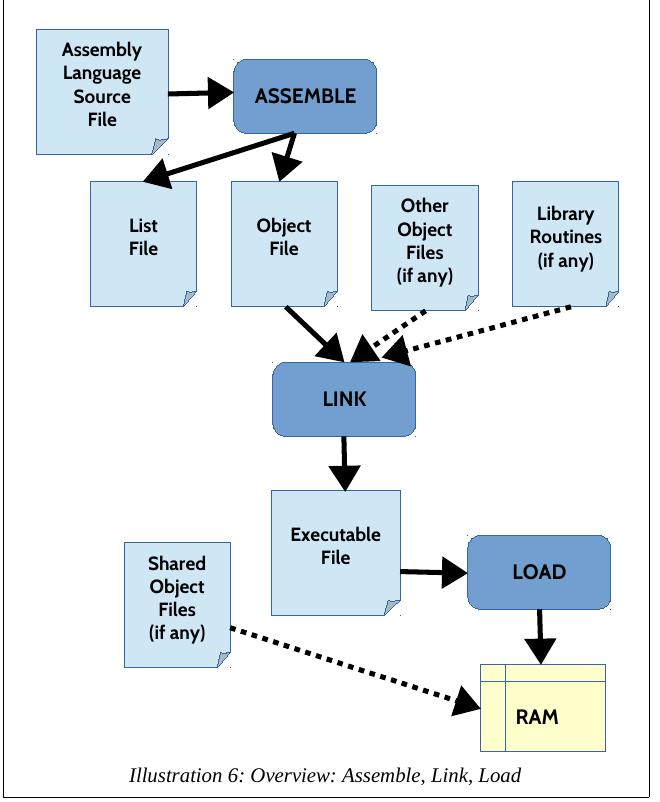
Note: List files are optional meta-data
Linkage:
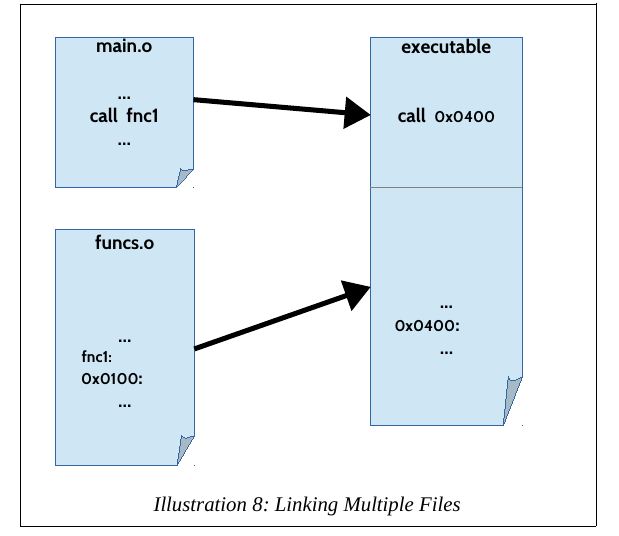
Note:
linkage like this is a process you must master in detail,
if you want to learn how to inject malware into already existing
binaries!
We’ll edit binaries during out upcoming assignemnt.
Compilation in general is split into roughly 5 stages:
1. Pre-processing,
2. Parsing,
3. Translation,
4. Assembling, and
5. Linking.
All 5 stages are implemented by one common program in UNIX, namely
gcc.
The general order of things goes:
gcc -> gcc -E -> gcc -S -> as -> ld
There are other toolchains available, and we’ll use some!
Demonstrate at the command line:
#!/bin/bash

# Recall incremental compilation
# (from data structures lab):
g++ -c myclass.cpp
g++ -c main.cpp
g++ myclass.o main.o
./a.out

# to generate assembly .s file
g++ -S simple-main.cpp
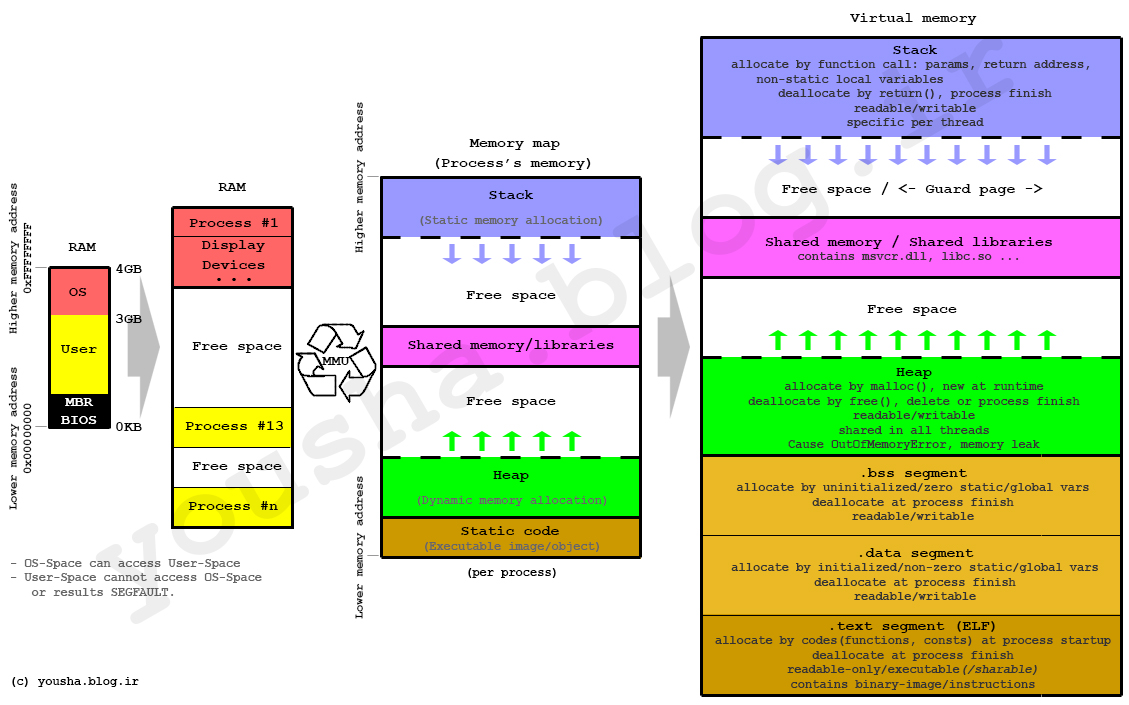
vim simple-main.s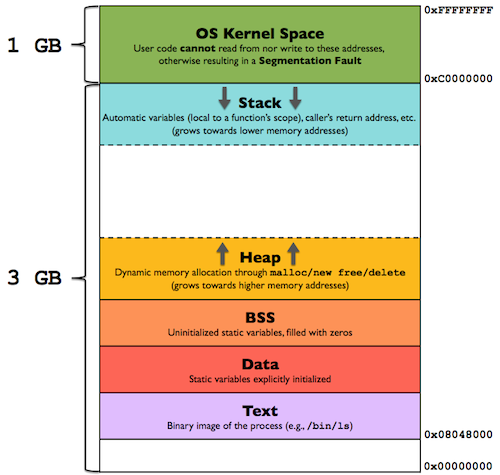
+++++++++++++++++++++ Cahoot-13b.4
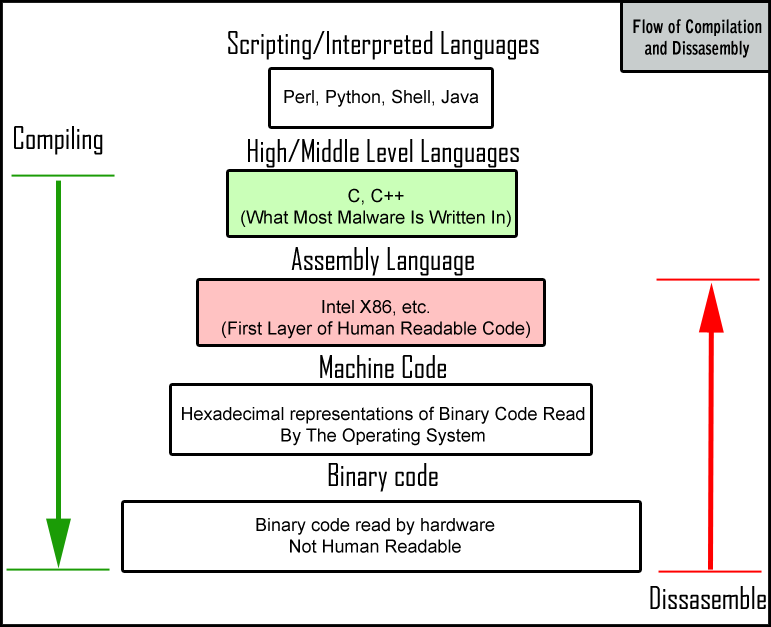
What was stuxnet (Recall the documentary watched) written in?
What is most malware written in?
What language fundamentals does most often malware exploit?
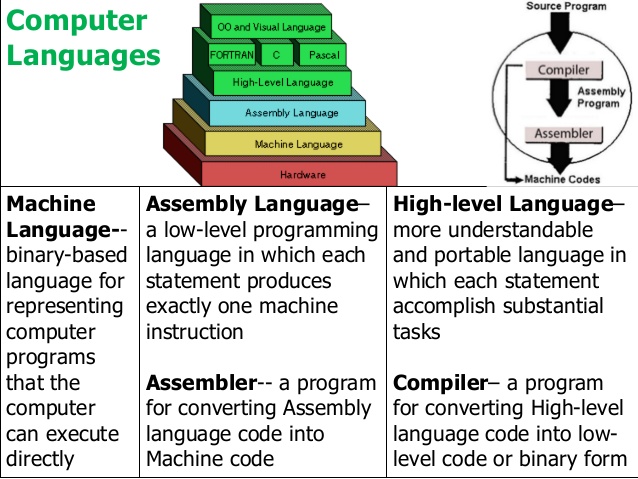 l
l
A low-level programming language is a programming
language that provides little or no abstraction from a computer’s
instruction set architecture commands or functions in the language map
closely to processor instructions.
Generally this refers to either machine code or assembly language.
The word “low” refers to the small or nonexistent amount of abstraction
between the language and machine language; because of this, low-level
languages are sometimes described as being “close to the
hardware”.
Programs written in low-level languages tend to be relatively
non-portable.
Machine code is a computer program written in machine language
instructions that can be executed directly by a computer’s central
processing unit (CPU).
Each instruction causes the CPU to perform a very specific task, such as
a load, a jump, or an ALU operation on a unit of data in a CPU register
or memory.
Machine code is the only language a computer can process directly
without a previous transformation.
Currently, programmers almost never write programs directly in machine
code, because it requires attention to numerous details that a
high-level language handles automatically.
Furthermore it requires memorizing or looking up numerical codes for
every instruction, and is extremely difficult to modify.
True machine code is a stream of raw, usually binary, data, but a
programmer coding in “machine code” normally codes instructions and data
in a more readable form such as decimal, octal, or hexadecimal
Example: A function in hexadecimal representation of 32-bit x86 machine code to calculate the nth Fibonacci number:
8B542408 83FA0077 06B80000 0000C383
FA027706 B8010000 00C353BB 01000000
B9010000 008D0419 83FA0376 078BD989
C14AEBF1 5BC3Assembly was a language people actually programmed in before C.
Assembly language usually has one statement per machine instruction, but
assembler directives, macros, and symbolic labels of program and memory
locations are often also supported for complex operations.
Assembly code is converted into executable machine code by a utility
program referred to as an assembler.
The conversion process is referred to as assembly, or assembling the
source code.
Assembly language uses a mnemonic to represent each
low-level machine instruction or opcode, typically also
each architectural register, flag, etc.
Many operations require one or more operands in order to form a complete
instruction.
Most assemblers permit named constants, registers, and labels for
program and memory locations, and can calculate expressions for
operands.
Programmers are freed from tedious repetitive calculations, and
assembler programs are much more readable than machine code.
Depending on the architecture, these elements may also be combined for
specific instructions or addressing modes, using offsets or other data,
as well as fixed addresses.
Example: The same Fibonacci number calculator as above, but in x86 assembly language using MASM (Microsoft Intel) syntax:
fib:
    mov edx, [esp+8]
    cmp edx, 0
    ja @f
    mov eax, 0
    ret

    @@:
    cmp edx, 2
    ja @f
    mov eax, 1
    ret

    @@:
    push ebx
    mov ebx, 1
    mov ecx, 1

    @@:
        lea eax, [ebx+ecx]
        cmp edx, 3
        jbe @f
        mov ebx, ecx
        mov ecx, eax
        dec edx
    jmp @b

    @@:
    pop ebx
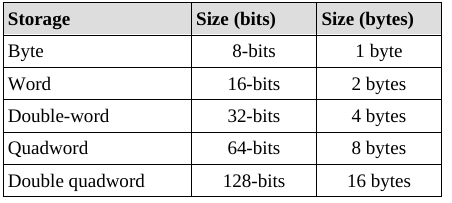
retThe x86-64 architecture supports a specific set of data storage size elements, all based on powers of two.
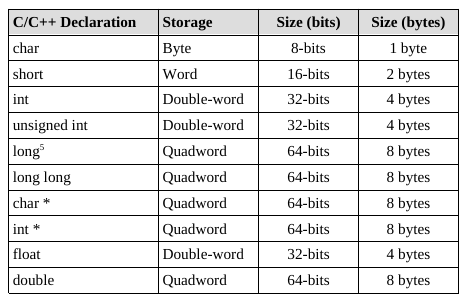
Mostly general purpose, with some special cases (discussed
below)
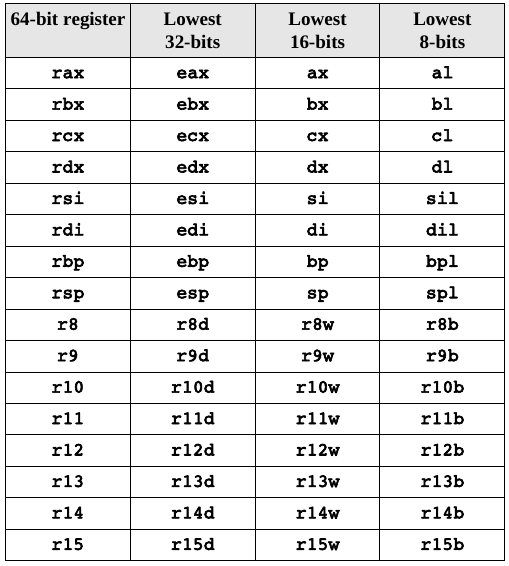
Hierarchical structure for backwards compatibility:

Each overlapping register shares memory (the older register names are
just accessing different chunks of the newer).

+++++++++++++++++++++ Cahoot-13b.5
Stack Pointer Register (RSP)
One of the CPU registers, rsp, is used to point to the current top of
the stack.
The rsp register should not be used for data or other uses.
Base Pointer Register (RBP)
One of the CPU registers, rbp, is used as a base pointer during function
calls.
The rbp register should not be used for data or other uses.
Instruction Pointer Register (RIP)
rip is used by the CPU to point to the next instruction to
be executed.
Specifically, since the rip points to the next instruction, that means
the instruction being pointed to by rip, and shown in the debugger, has
not yet been executed.
This is an important distinction which can be confusing when reviewing
code in a debugger.
It actually causes the choice about which instruction is to be executed
next.
Flag Register (rFlag)
The flag register, rFlag, is used for status and CPU control
information.
The rFlag register is updated by the CPU after each instruction, and is
not directly accessible by programs.
This register stores status information about the instruction that was
just executed, for example comparisons.
Of the 64-bits in the rFlag register, many are reserved for future
use.
XMM Registers
There are a set of dedicated registers used to support:
64-bit and 32-bit floating-point operations, and
Single Instruction Multiple Data (SIMD) instructions.
The SIMD instructions allow a single instruction to be applied
simultaneously to multiple data items.
Used effectively, this can result in a significant performance
increase.
Typical applications include some graphics processing and digital signal
processing.
Registers include xmm0-15.
https://en.wikipedia.org/wiki/Byte_addressing
Each address increment indexes into an 8-bit (1-byte) chunk.
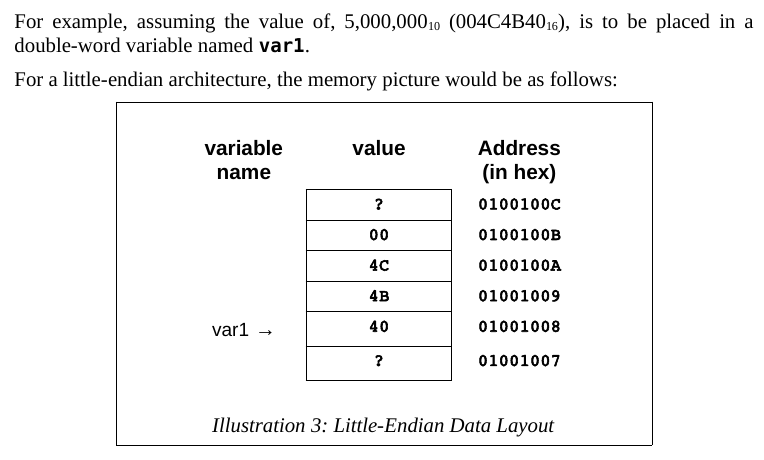
https://en.wikipedia.org/wiki/Endianness
Little-endian, which means that the Least
Significant Byte (LSB) is stored in the lowest memory
address.
The Most Significant Byte (MSB) is stored in the
highest memory location.

This is asm source code:
Note the numeric bases in asm source code.
The below apply when writing/editing asm source code:
If not specified, numbers are base 10
https://en.wikipedia.org/wiki/Base_10
0x precedes hex
https://en.wikipedia.org/wiki/Hexadecimal
For example, a decimal 127, as hex would be 0x7f
q follows octal
https://en.wikipedia.org/wiki/Octal
For example, a decimal 511, as octal would be 777q
Ultimately, the machine code itself is binary
https://en.wikipedia.org/wiki/Binary_code
https://en.wikipedia.org/wiki/Binary_number
Positive and negative numbers
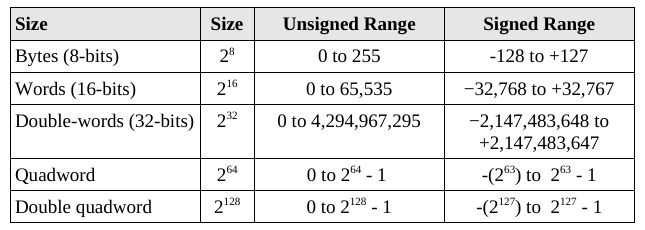
For representing unsigned values within the range of a given storage size, standard binary is used.
For representing signed values within the range,
two’s complement is used:
Specifically, the two’s complement encoding process
applies to only the values in the negative range.
For values within the positive range, standard
binary is still used.

To take the two’s complement of a number:
1. take the one’s complement (negate)
2. add 1 (in binary)
Byte example (positive vs. negative)

When adding 1, recall that the manual procedure for adding in binary is
similar to decimal.
Word example (positive vs. negative)

Unsigned and signed addition
The above encoding trick enables addition and subtraction to operate
seamlessly:

Floats
IEEE 754 32-bit floating point standard:
https://en.wikipedia.org/wiki/IEEE_754

It’s complicated… if you care to know the details, read up more:
ReverseEngineering/assembly64.pdf
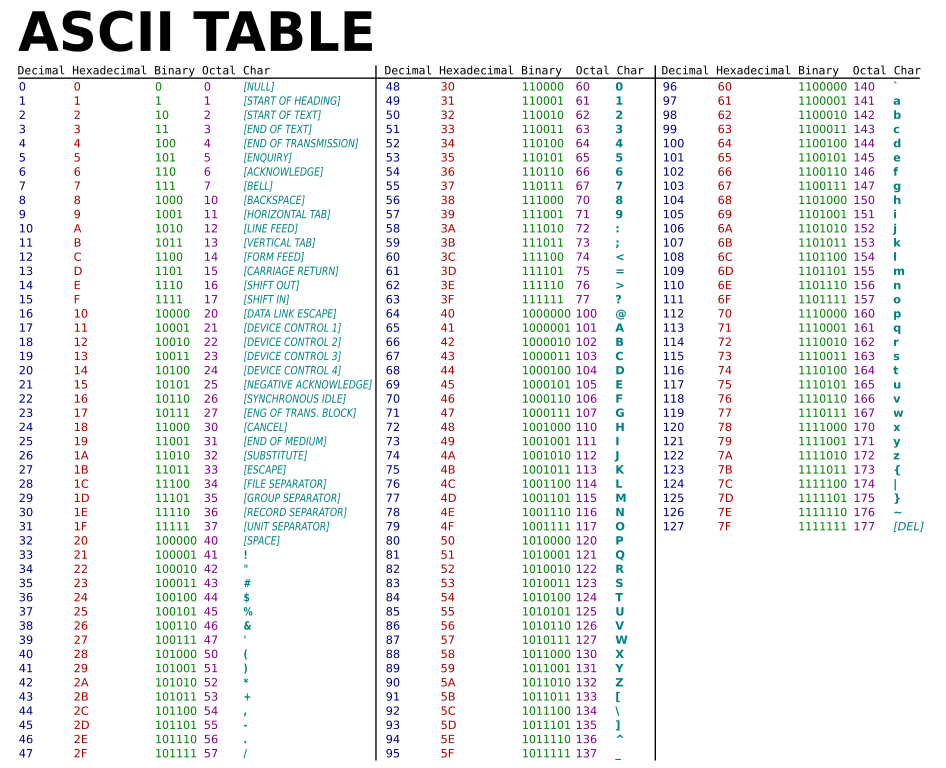
Strings (characters)
These are just encoded integers, which you should be very comfortable
with at this point:
https://en.wikipedia.org/wiki/Ascii
https://en.wikipedia.org/wiki/UTF-8

Numbers as strings are still characters:

Note:
With so many different encodings,
you may or may not know what encoding was intended,
especially when reverse engineering.
Thus, it is particularly helpful to have a debugger,
which displays them all at once
(e.g., qtcreator, gdb, or ghidra,
as demonstrated below).
A good way to learn (will trace some like this later, but not
now).
In ReverseEngineering/asm_demos.tar.xz
simple-main.cpp linked to
qtcreator/simple-main/main.cpp
// This is a basic C++ program
#include <iostream>
using std::cin;
using std::cout;
using std::endl;

int main() {
  char cstring[14] = "Hello, world!";
  cout << cstring << endl;
  cin >> cstring;
  cout << cstring;

  return 0;
}
And at the command line:
#!/bin/bash

g++ -g simple-main.cpp

./a.out

# new term
ps -aux | grep a.out

vim /proc/<pidabove>/maps

# check it twice, for different runs,
# to show memory randomization of libs
And at the command line:
#!/bin/bash
# to generate assembly .s file

# AT&T
g++ -S simple-main.cpp
vim simple-main.s

# Intel
g++ -g simple-main.cpp
objdump -M intel -d a.out >aout_objdump.asm
vim aout_objdum.asmReview of two syntax choices:
gas often named *.s
ReverseEngineering/asm_demos.tar.xz
00_gas_exit.s
Intel often named *.asm
ReverseEngineering/asm_demos.tar.xz
00_nasm_exit.asm
; nasm/yasm syntax
; This is a comment

section .text

global _start

_start:
    mov  rax, 60
    mov  rdi, 0
syscallA bug to watch out for:
nasm/ld/gdb on Fedora-36 does not show source,
as it should (a bug in one of those three packages),
though it does on Debian-11.
To show source during debugging on both platforms,
yasm/ld/gdb and as/ld/gdb both work well.
#!/bin/bash
# general asm compilation, linking, and execution

# asm: assuming an assembly file, main.asm or main.s
nasm -f elf64 -g -F dwarf 00_nasm_exit.asm
# or
nasm -f elf64 -gdwarf 00_nasm_exit.asm
# or
yasm -f elf64 -g dwarf2 00_nasm_exit.asm
# or
as --gstabs+ 00_gas_exit.s -o 00_gas_exit.o

# then
ld 00_nasm_exit.o
# run it:
./a.out
gdb a.out

# Demonstrate changing exit code and re-running.

ld 00_gas_exit.o
# run it:
./a.out
gdb a.out
# (gdb) set disassembly-flavor intel
# (gdb) b 1
# (gdb) start
# (gdb) layout next
# (gdb) nexti

# To set the default asm flavor to Intel instead of AT&T in GDB:
cd ~
echo "set disassembly-flavor intel" >>.gdbinit
cd -

# to convert from Intel/NASM/YASM to GAS/as/ATT
# or vice versa
# Note: intel2gas may do most of the conversion,
# but leave some parts that need manual fixing
intel2gas nasm.asm >gas.s
intel2gas -g gas.s >nasm.asm
+++++++++++++++++++++ Cahoot-13b.6
To find system calls, see this list:
For their usage, see the Appendix C of this book:
ReverseEngineering/assembly64.pdf
Sections of an Intel-asm source code file include the following:
; Comments are written like this.
Data section for initialized data (constants and
variables)
section .data
In asm, variable declarations:
db 8-bit variable(s)
dw 16-bit variable(s)
dd 32-bit variable(s)
dq 64-bit variable(s)
ddq 128-bit variable(s) integer
dt 128-bit variable(s) float
Constants defined using general format:
<name> equ <value>
; MYVAR const equal to 100
MYVAR equ 100
Variables declared using general format:
<variableName> <dataType> <initialValue>
; myvar 64-bit variable equal to 100
myvar dq 100
For more sizes, see the book for details.
BSS section for un-initialized data (For example,
arrays)
section .bss
In asm, un-initialized data declaration:
resb 8-bit variable(s)
resw 16-bit variable(s)
resd 32-bit variable(s)
resq 64-bit variable(s)
resdq 128-bit variable(s)
Blocks of data declared using general format:
<variableName> <resType> <count>
; 20 element quad array
qArr resq 20
Text section for the actual asm code you write
section .text
Special _start label is used:
global _start
_start:
_start is like the “main” function.
More on labels coming up later.
A whole program:
ReverseEngineering/asm_demos.tar.xz
01_format.asm
; Simple example demonstrating basic program format and layout.

; Initialized data section
section .data
; Some basic data declarations

; Define constants
EXIT_SUCCESS equ 0      ; successful operation
SYS_exit equ 60         ; call code for terminate

; quadword (64-bit) variable declarations
qVar1 dq 170000000
qVar2 dq 90000000
qResult dq 0

; Uninitialized data
section .bss
; 20 element quad array (not used below...)
; just an example of how to declare one
qArr resq 20

; Text (code) section
; This stuff defines a special label
; More later on labels
section .text
global _start
_start:
    ; so we can see the address of qResult in rax
    mov rax, qResult
    ; >>> info address qResult
    ; >>> p &qResult
    ; >>> dasbhboard memory watch <addresss above> <length>
    ; >>> x/dg <address above>
    ; Quadword example
    ; qResult = qVar1 + qVar2
    mov rax, qword [qVar1]
    add rax, qword [qVar2]
    mov qword [qResult], rax
    ; >>> x/dg <address above>

; Done, terminate program.
mov rax, SYS_exit   ; Call code for exit
mov rdi, EXIT_SUCCESS   ; Exit program with success
syscallFor a pretty thorough and clear walk-through of x86_64
assembly,
in YASM syntax (similar to NASM), see:
ReverseEngineering/assembly64.pdf
How to compile the following source code examples for GDB functionality:
nasm -f elf64 -g -F dwarf <whatever.asm>
# or:
yasm -f elf64 -g dwarf2 "$filename".asm
ld <whatever.o>
A bash script similar to the Makefile in the attached code:
ReverseEngineering/asm_demos.tar.xz
./nas.sh
#!/bin/bash

for filename in *.asm; do
    filename=$(basename --suffix=".asm" "$filename")

    # nasm used to work, but no longer includes debug source (bug)?
    # nasm -f elf64 -g -F dwarf "$filename".asm
    yasm -f elf64 -g dwarf2 "$filename".asm
    ld "$filename".o -o "$filename".out
    rm "$filename".o
done
To assemble and link your asm source code files (each being an independent program for now).
Preview:
Most asm operations need at least one operand in a register,
rather than just in RAM (on the stack), mov included.
mov would more aptly be named copy…
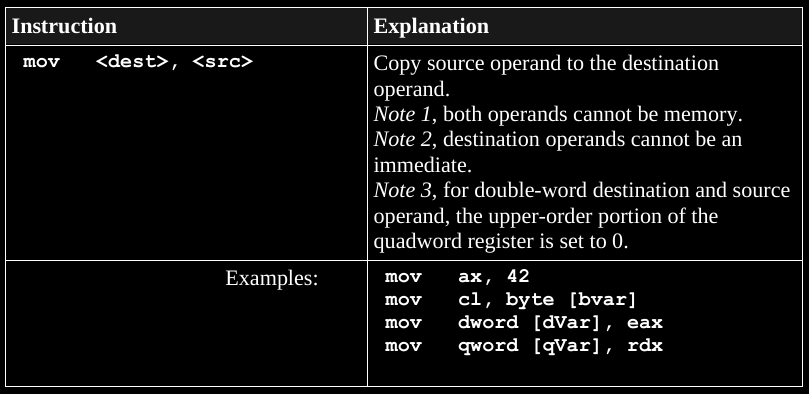
For this topic, skim this in the book for more if you want to.
Important!
Like in C/C++, there is an important distinction between:
the address of a variable, and
the value held at that address.
an array, and
in the elements of the array.
For example,
where var1 is a named variable,
stored on the stack:
; value stored in var1 copied into rax
mov rax, qword [var1]; address of var1 copied into rax
mov rax, var1Brackets
Registers don’t have addresses in this sense,
so if we were to wrap them in brackets,
then it serves a different, though consistent,
purpose and mechanism.

We’ll discuss this whole idea more soon,
so this is just an introduction.
lea was intended for constructing addresses,
whether that address is accessed either:
as a stack variable itself, or
as a register containing an address of a data stored on the stack.
Side note:
I’ve never seen the size specification used for lea,
like in the image above,
and suspect it may be a mistake/typo in the book we’re using…
mov and lea differ, for example:
Given some registers and memory,
with EBX storing an address of memory on the stack:
+------------------+                  +------------+
| Registers        |                  | Memory     |
+------------------+                  +------------+
| EAX = 0x00000000 |       0x00403A40 | 0x7C81776F |
| EBX = 0x00403A40 |       0x00403A44 | 0x7C911000 |
+------------------+       0x00403A48 | 0x0012C140 |
                           0x00403A4C | 0x7FFDB000 |
                                      +------------+
lea eax, [ebx+8]
Means put [ebx+8] into EAX.
After this instruction,
EAX will equal 0x00403A48.
In contrast, the instruction:
mov eax, [ebx+8]
will make EAX equal to 0x0012C140
Illustrated differently:
mov eax, [ebx+8]
means
mov eax, ebx
add eax, 8
mov eax, [eax]
whereas
lea eax, [ebx+8]
means
mov eax, ebx
add eax, 8
lea is often abused to do addition of numbers,
rather than addresses,
as it was intended.
This is even done by some compilers…
Basic math.
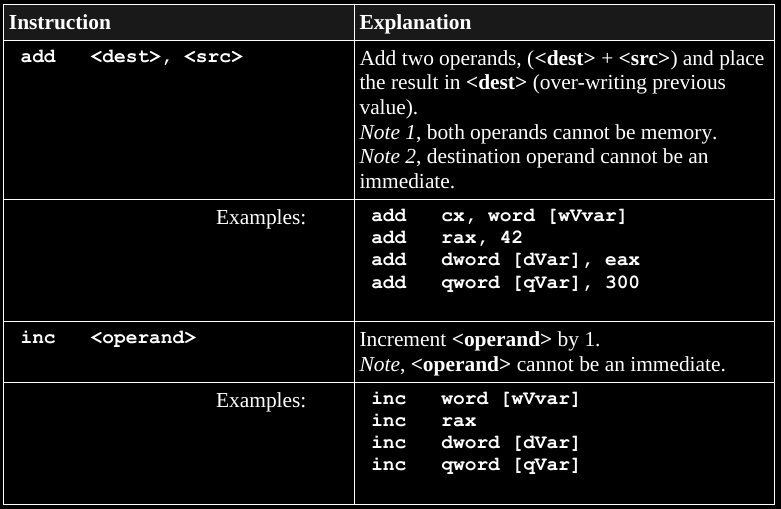
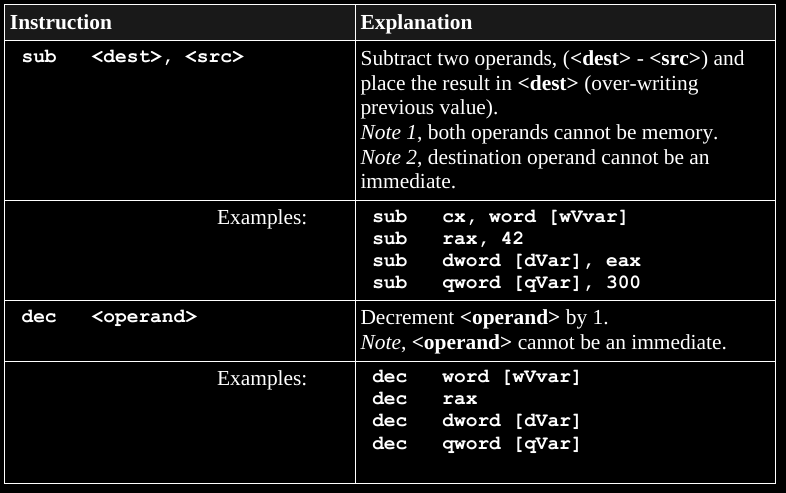
Skim this during lecture, read more in the book if you want it thoroughly.
Multiplying two smaller numbers can result in a bigger one.
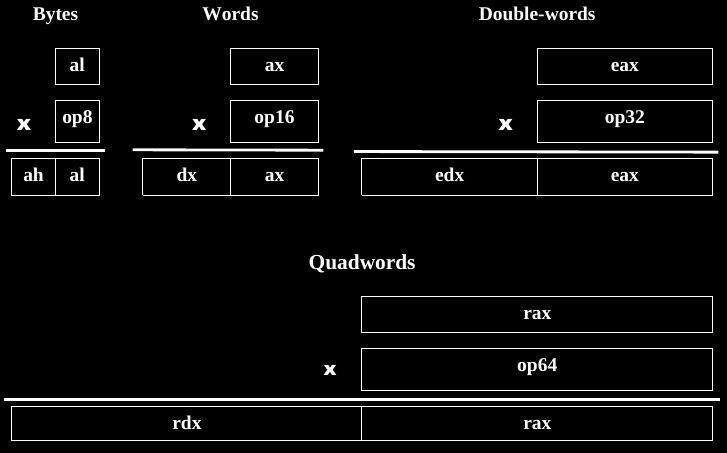
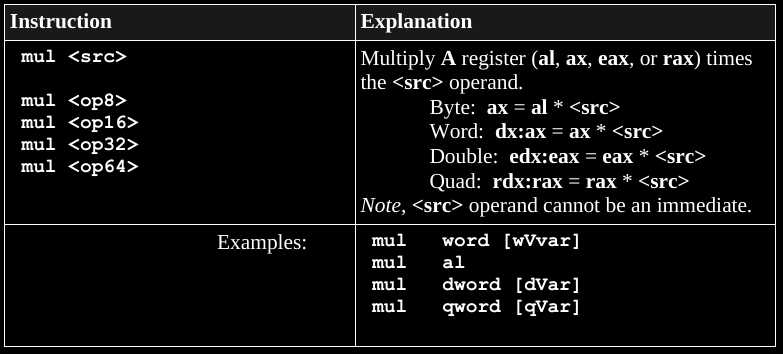
+++++++++++++++++ Cahoot-13b.7
Skim this one, read the book for more detail.
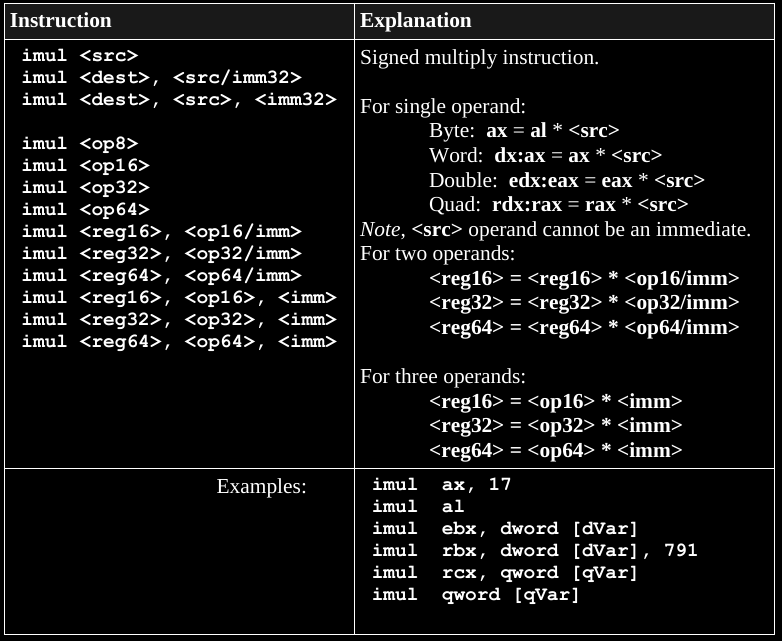
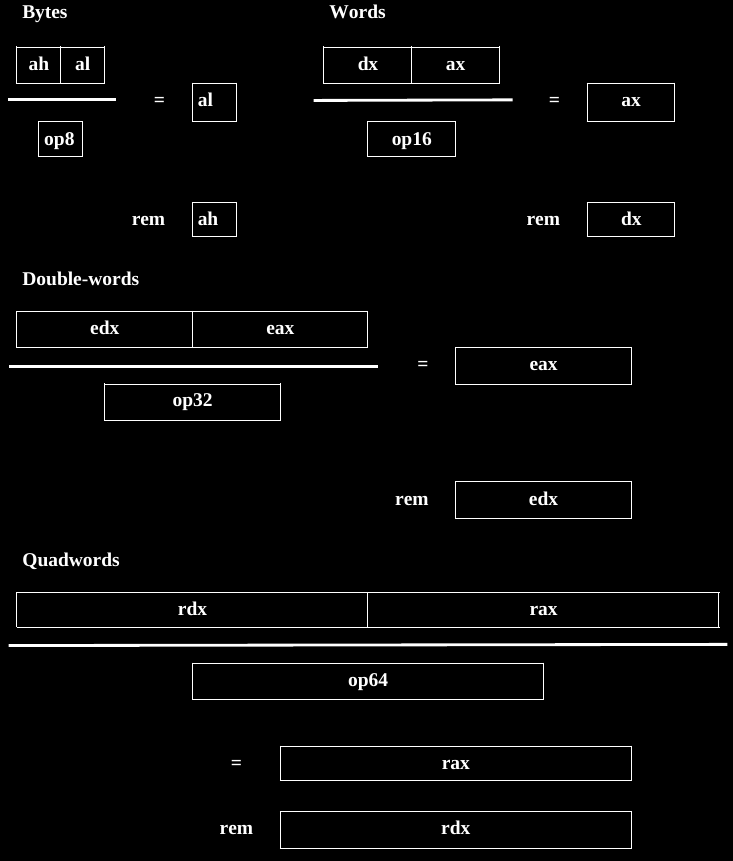
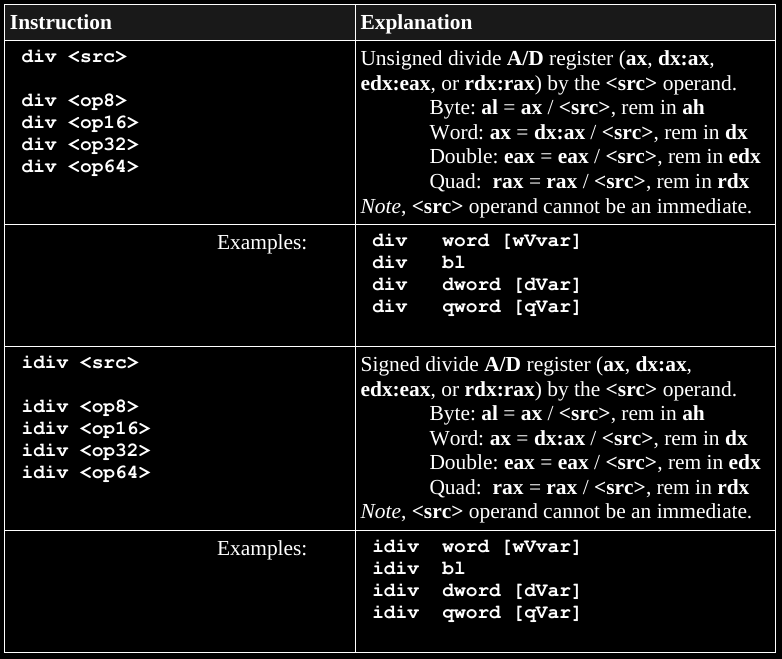
Skim this during lecture,
read more in the book if you want it thoroughly.
Dividing one number by the other may require the numerator’s
representation is larger.
Given the left two columns, the right 4 depict the bitwise
operations:
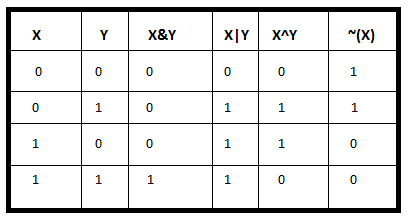
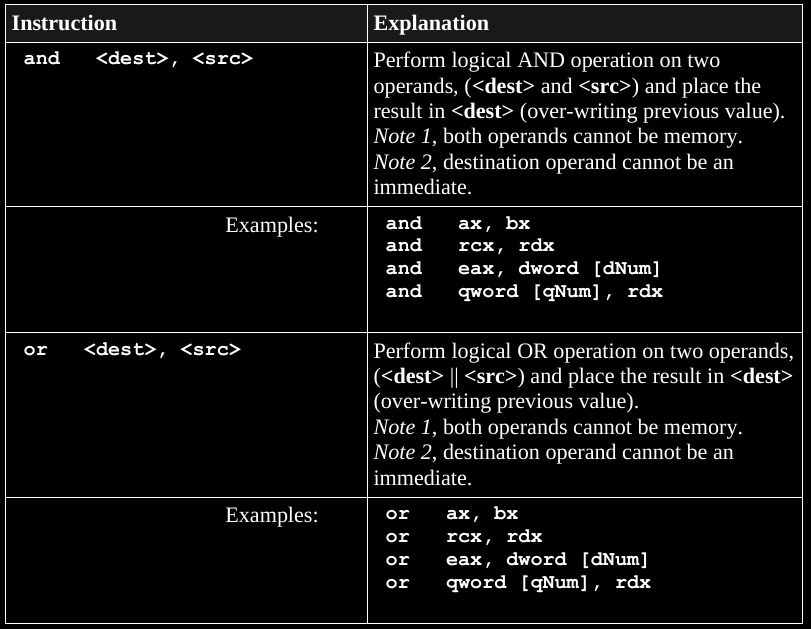
The following operations are all done bit-wise:
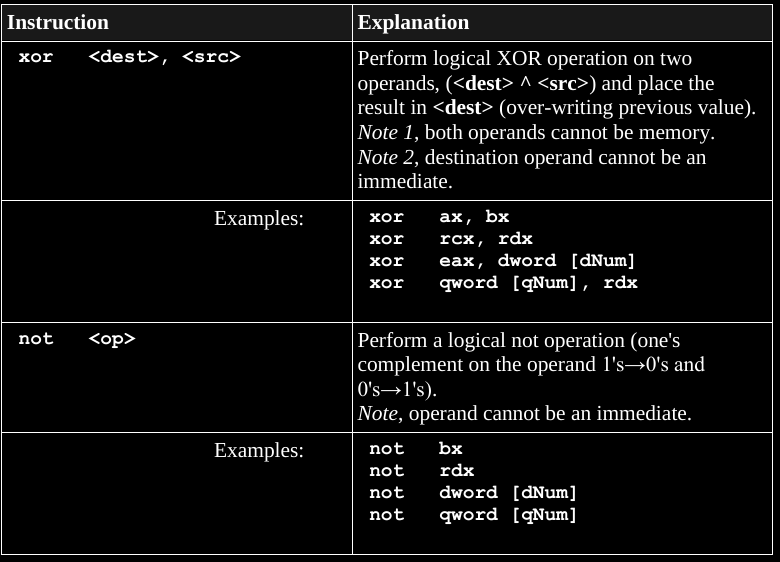
Skim bit-shifts and rotations in the book if you want to.
We don’t have any high-level if statements, while loops, or for loops
in asm.
Instead, high-level language control structures must be
constructed,
from more primitive assembly operations.
A program label can be a target of a jump,
a location to jump to.
This is used in to control flow.
For example:
The start of a loop might be marked with a label such as:
loopStart: in the following asm code:
loopStart:
    mov rax, 1
jmp loopStart
What happens when we execute this??
Code may be re-executed by jumping back to a label.
Naming rules:
Labels should be unique, and defined once.
Labels in yasm and nasm are case sensitive.
Generally, a label starts with a letter,
followed by letters, numbers, or symbols (limited to “_“),
terminated with a colon (”:“).
It is possible to start labels with non-letter characters
(i.e., digits, “_“,”$“,”#“,”@“,”~” or “?”).
However, these typically convey special meaning and,
in general, should not be used by programmers.

These un-conditional jumps can jump further away in code than
conditional jumps can.
To build a conditional jump, first we need to compare values:
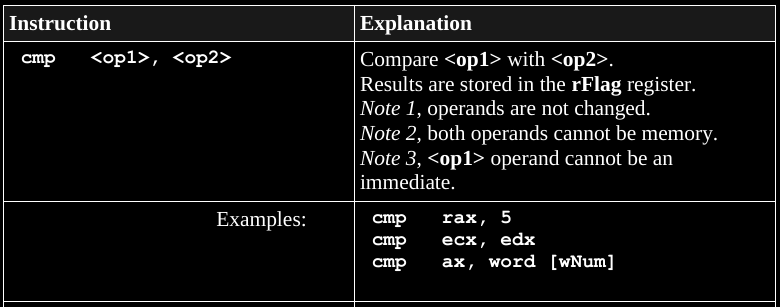
https://en.wikipedia.org/wiki/FLAGS_register
cmp leaves an answer to the comparison it performs in the
rFlag register.
Then, as long as you don’t modify the rFlag register,
with other following operations,
then its values can be used for conditional jumping.
Thus, for conditional comparison and jumping,
you must compare immediately before using jmp.
General form of logic:
Jump if op1 relation to op2
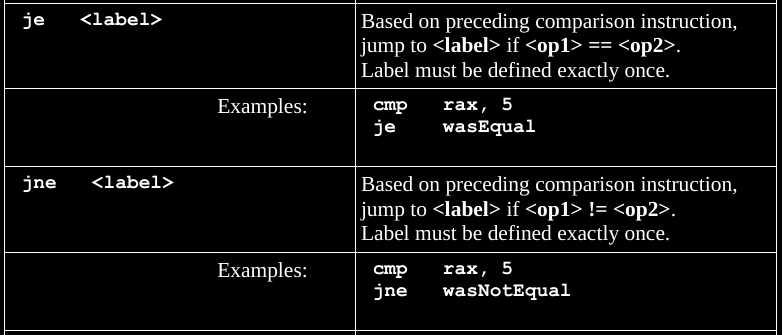
and many more conditional jump operators:
je <label>     ; if <op1> == <op2>
jne <label>     ; if <op1> != <op2>
jl <label> ; signed, if <op1> < <op2>
jle <label> ; signed, if <op1> <= <op2>
jg <label> ; signed, if <op1> > <op2>
jge <label> ; signed, if <op1> >= <op2>jb <label> ; un-signed, if <op1> < <op2>
jbe <label> ; un-signed, if <op1> <= <op2>
ja <label> ; un-signed, if <op1> > <op2>
jae <label> ; un-signed, if <op1> >= <op2>An easy way to remember how to apply these,
is that the order is as you would read it:
cmp op1 op2
jle my_label
jump if operand 1 is less than or equal to operand 2
or
cmp op1 op2
jg my_label
jump if operand 1 is greater than operand 2
Example in C++
if(myMax < currNum)
    myMAx = currNum;
Implemented in asm:
    currNum dq 0
    myMax dq 0
...
    mov rax, qword [currNum]
    cmp rax, qword [myMax] ; if currNum <= myMax
    jle notNewMax ; skip set new max
    mov qword [myMax], rax
notNewMax:
The logic for the IF statement has been reversed,
from what might seem intuitive based on the C++ above.
If the condition from the original IF statement is false,
the code in the if block must not be executed.
Thus, when false, in order to skip the execution,
the conditional jump will jump to the target label,
immediately following the code to be skipped (not executed).
While there is only one line in this example,
there can be many lines of code to be skipped (the if block code).
Loops come in the two forms:
1) manual, and
2) shortcut loop macro:
A basic loop can be implemented with:
a counter, which is checked at either the bottom or top of a loop with a cmp, and
a conditional jump, which can be
implemented with:
a compare, and
a conditional jump
Sums the first n odd numbers:
    lpCnt dq 15
    sum dq 0
...
    mov rcx, qword [lpCnt]
    mov rax, 1 ; the first odd number
sumLoop:
    add qword [sum], rax
    add rax, 2 ; the next odd number
    dec rcx
    cmp rcx, 0
    jne sumLoop
Though there are many ways to implement a loop,
this is the most common one,
counting down from n to 0.
A compiler may convert other types of loop to this mechanism,
but will not always.
Question:
can a for loop and while loop look exactly the same in assembly?
rcx is used as a counter by convention for manual
looping,
and by the following convenience method:
Instead of this:
; set rcx
<label>
<code>
dec rcx
cmp rcx, 0
jne <label>
You can do this instead:
; set rcx
<label>
<code>
loop <label>

Mimicking the above example of summing the first n odd numbers, now a bit shorter:
    lpCnt dq 15
    sum dq 0
...
    mov rcx, qword [lpCnt]
    mov rax, 1
sumLoop:
    add qword [sum], rax
    add rax, 2 ; next odd number
    loop sumLoop
Ask: What happens with nested loops and the use of rcx?
First, look over the code:
ReverseEngineering/asm_demos.tar.xz
./02_sos.asm
; Computes sum of squares from 1 to n, e.g.,
; 1^2 + 2^2 + ... + 10^2 = 385

section .data

SUCCESS equ 0
SYS_exit equ 60

n dd 10
sumOfSquares dq 0

section .text

global _start
_start:

mov rbx, 1
mov ecx, dword [n]
; >>> info address n
; >>> info address sumOfSquares
; >>> p &n
; >>> p &sumOfSquares
; >>> x/dw <address_of_n>
; >>> x/dg <address_of_sumOfSquares>
; >>> dashboard memory watch <address_of_n>-32 64
; >>> dashboard memory watch <address_of_sumOfSquares>-32 64
sumLoop:
    mov rax, rbx
    mul rax
    add qword [sumOfSquares], rax
    ; >>> x/dg n
    ; >>> x/dg sumOfSquares
    inc rbx
    loop sumLoop

last:
    mov rax, SYS_exit
    mov rdi, SUCCESS
    syscall
Next, debug in gdb:
#!/bin/bash

./nas.sh
gdb ./02_sos.out
# (gdb) b 1
# (gdb) start
# (gdb) layout next
# enter (repeat) until you see registers and source
# (gdb) nexti
# (gdb) stepi

# To show the stack:
# (gdb) x/dg &sumOfSquares
+++++++++++++++++ Cahoot-13b.8
Three basic addressing modes are:
1. Register, like rax
2. Immediate, like 5
3. Memory, like [var1]
On a 64-bit architecture, addresses require 64-bits.
mov rax, qword [var1] ; value of var1 in rax
mov rax, var1 ; address of var1 in rax
Sizes can be made explicit (and sometimes must be):
inc byte [myvar]
; next two do the same as the first line
mov rbx, myvar
inc byte [rbx]
; just some more examples:
inc word [rbx]
inc dword [rbx]
mov rbx, 5
inc rbx
Mention:
We said that [] with registers does not apply??
In this case, we assume rbx holds an address, which
references some memory, and that’s what gets incremented.
Value from a register:
mov eax, ebx
Value from an immediate:
mov eax, 123
Value from RAM (maybe somewhere on the stack):
mov rax, qword [qNum]
For example, a contiguously allocated block:
lst dd 101, 103, 105, 107
That array on the stack:
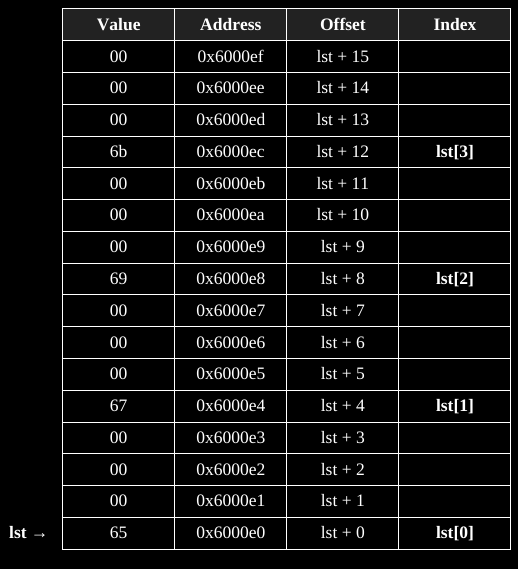
The first element of the array could be accessed as follows:
mov eax, dword [lst]
Another way to access the first element is as follows:
mov rbx, lst
mov eax, dword [rbx]
Note: rbx stores an address, which is why we use [] above to dereference a layer and get the value.
One way to access array elements is to use a base address and add a displacement.
For example, accessing the 3rd element of a list,
lst
mov rbx, lst ; address of lst into rbx
mov rsi, 8 ; 8 into rsit
...
; these are the same:
mov eax, dword [lst+8]
mov eax, dword [rbx+8]
mov eax, dword [rbx+rsi]
In general, one can do:
[ baseAddr + (indexReg * scaleValue ) + displacement ]
For example, to access the 3rd element of the previously defined double-word array (which is index 2, since indices always start at 0):
mov rsi, 2 ; index=2
mov eax, dword [lst+rsi*4]
This is needed to accomplish the “magic” that C++ performs in using
pointer arithmetic, for example:
Adding 8 to the address at the beginning of the array increments 8
appropriately sized chunks later in the array,
based on the size of the type of the elements in that array.
First, check out the code:
ReverseEngineering/asm_demos.tar.xz
03_sumlist.asm
; Computes sum of a list of numbers

section .data

EXIT_SUCCESS equ 0
SYS_exit equ 60
lst dd 1002, 1004, 1006, 1008, 10010
len dd 5
sum dd 0

section .text
global _start
_start:

mov ecx, dword [len]
mov rsi, 0

sumLoop:
    mov eax, dword [lst+(rsi*4)]
    add dword [sum], eax
    inc rsi
    loop sumLoop

last:
    mov rax, SYS_exit
    mov rdi, EXIT_SUCCESS
    syscall
Then, debug it in gdb:
#!/bin/bash

./nas.sh
gdb ./03_sumlist.out
# (gdb) b 1
# (gdb) start
# (gdb) layout next
# enter (repeat) until you see registers and source
# (gdb) nexti
# (gdb) stepi

# To show the stack:
# (gdb) x/dw &sum
# (gdb) x/5dw &lst
# How is memory structured here:?
# (gdb) x/6dw &lst
Ask:
Reversing compilation is not perfect, why?
Ambiguity of relative versus absolute addressing (like walking through an array)
+++++++++++++++++ Cahoot-13b.9
exists in RAM, and can store extra data for indirect use by the processor and/or for copying to or from registers, for more direct use by the processor.
A reminder about the general principle of a stack:
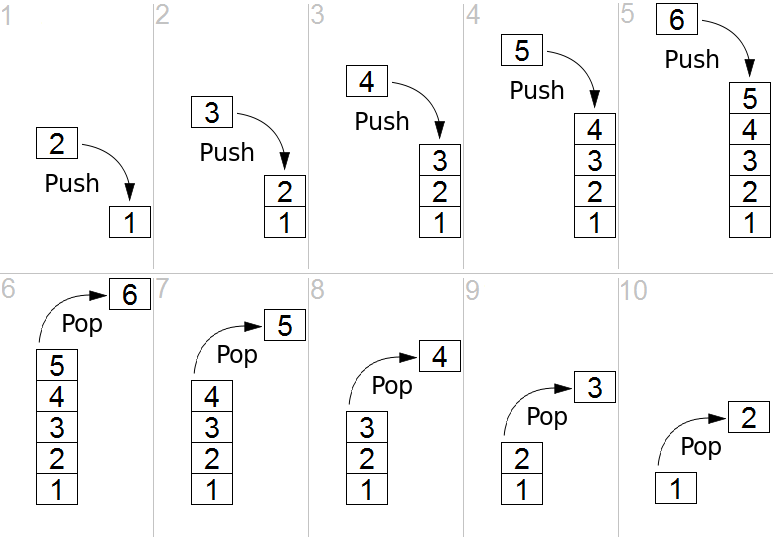
This stack we’re now talking about is the stack
you’ve been hearing about for years.
It keeps your stack variables, function call meta-data (activation
records / stack frames), etc.
We will learn how to manually manipulate the stack, first today, and
more deeply next time, when we cover function calls.
The rsp register keeps track of the top of the
stack.
It does so by storing an address.
Addresses are dq (64bit double quadword) hex numbers on our x86-64bit
platform.
rsp does NOT store the data itself (though it could
hypothetically store data).
Unless you are using rsp to keep track of the stack
manually, you should probably not be modifying the contents of rsp!
Our next two asm operations include: push and
pop which:
1) copy items to and from the stack, and
2) manipulate rsp by incrementing or decrementing the
address in rsp
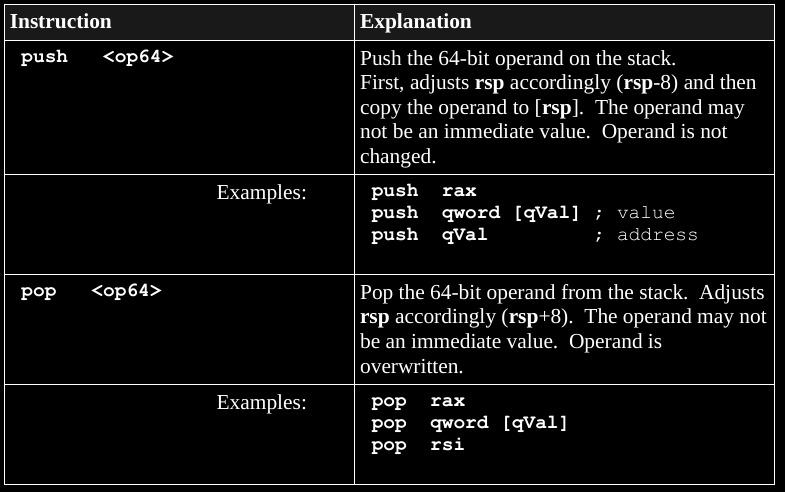
For a push operation:
1. The rsp register is decreased by 8 (1 quadword).
2. The operand is copied to the stack at rsp.
The operand is not altered.
The order of these operations is important.
For a pop operation:
1. The current element at top of the stack, at rsp,
is copied into the operand.
2. The rsp register is increased by 8 (1 quadword).
For example moving these values to the stack:
mov rax, 6700     ; 6700 = 0x00001A2C
push rax
mov rax, 31     ; 6700 = 0x0000001F
push rax
See the stack image below, where these numbers appear.
Remember:
Higher addresses are up in the stack.
x86_64bit asm is byte-addressable (each byte has an address).
x86_64bit asm is big-endian (least significant digits at lower addresses
within a data item).
Pushing first starts at higher addresses, and pushing again adds “below”
the previously pushed values and addresses.
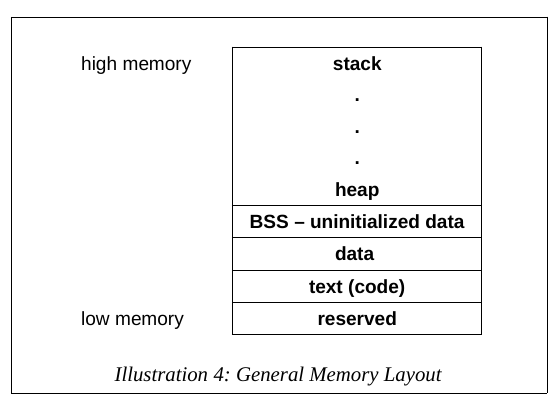
This means that variables declared first exist above those declared
after, usually in the same order as in your source code!
Can we exploit that?

Draw this stack out, step by step, during lecture.
ReverseEngineering/asm_demos.tar.xz
04_stackops.asm
; Basic stack operations to reverse a list

section .data

EXIT_SUCCESS equ 0
SYS_exit equ 60

numbers dq 121, 122, 123, 124, 125
len dq 5

section .text

global _start
_start:

; push loop here:
    mov rcx, qword [len]
    mov rbx, numbers
    mov r12, 0
    mov rax, 0

pushLoop:
    push qword [rbx+r12*8]
    inc r12
    loop pushLoop

; pop loop here:
    mov rcx, qword [len]
    mov rbx, numbers
    mov r12, 0

popLoop:
    pop rax
    mov qword [rbx+r12*8], rax
    inc r12
    loop popLoop

last:
    mov rax, SYS_exit
    mov rdi, EXIT_SUCCESS
    syscall
To view values at an address in a register
x/dg $rbx
x/5dg $rbx
Either:
>>> dashboard memory watch <address> <length>
>>> p $rsp
>>> dashboard memory watch 0x7fffffffe070-128 256
Remember, the stack grows by subtracting values.
or:
To view (x/)
the decimal (d)
giant double-quadword (g)
at the top of the stack (rsp):
>>> x/dg $rsp
Or, if you want to do multiple chunks at a time,
for example 5 dq elements:
>>> x/5dg $rsp
++++++++++++ Cahoot-13b.10
Trace this in qtcreator:
ReverseEngineering/asm_demos.tar.xz
qtcreator/vars_condition_loops/main.cpp linked as
vars_condition_loop.cpp
// Simple program for basics of reversing
// Does not have any includes, to keep it clean and simple
// Trace once over C++, then over ASM.

int global_var = 1;

int main() {
  int x;
  x = 4;

  // This gets a later allocation
  int y = 4;

  int anothervar{2};

  // Note debugger skips this line when stepping:
  // Those declared this way get allocated BEFORE those 1-liners just above
  int my_var;
  my_var = 0;

  // How do these differ??
  x++;
  x += 1;
  x = x + 1;

  if (x < 5) {
    my_var = 1;
    my_var += global_var;
  } else {
    my_var = 0;
    my_var += global_var;
  }

  for (int i = 0; i < 2; i++) {
    my_var++;
  }

  while (my_var > 0) {
    my_var--;
  }

  // These two array inits are equivalent mechainsms:
  int main_array1[3]{1, 1, 1};

  // Note debugger skips this line (pre-allocated).
  int main_array[3];
  main_array[0] = 1;
  main_array[1] = 1;
  main_array[2] = 1;

  // A C-string
  char my_cstring[4] = "hey";
  my_cstring[0] = 'y';

  // Pointers and addresses:
  int *intptr = new int{7};
  (*intptr)++;
  *intptr += 1;
  *intptr = *intptr + 1;

  // Just to show you what doubles and longs look like:
  double big_num = 23420.001;
  big_num = big_num + 5.01;

  long big_unsigned_int = 70002;
  big_unsigned_int += 3;

  return 0;
}
++++++++++++ Cahoot-13b.10
++++++++++++ Cahoot-13b.11
Example binary code files (mostly compiled from C):
/usr/bin/sudo, /usr/bin/su, PAM, etc.
What might a flaw or bug in these programs enable?
Check out this stacked example…
ReverseEngineering/asm_demos.tar.xz
qtcreator/buffer-overflow/main.cpp linked to
buffer-overflow.cpp
#include <cstring>
#include <iostream>

using std::cin;
using std::cout;
using std::endl;

int main() {
  int authentication = 0;
  cout << "authentication: " << authentication << endl;
  cout << "&authentication: " << &authentication << endl;

  char cUsername[10];
  cout << "cUsername: " << cUsername << endl;
  cout << "&cUsername: " << &cUsername << endl;

  char cPassword[10];
  cout << "cPassword: " << cPassword << endl;
  cout << "&cPassword: " << &cPassword << endl;

  cout << "Enter username: ";
  cin >> cUsername;

  cout << "Enter password: ";
  cin >> cPassword;

  cout << endl;

  if (strcmp(cUsername, "admin") == 0 && strcmp(cPassword, "adminpass") == 0) {
    authentication = 1;
  }

  if (authentication) {
    cout << "authentication as int: " << authentication << endl;
    cout << "char(authentication): " << (char)authentication << endl;
    cout << "after auth, username was: " << cUsername << endl;
    cout << "after auth, password was: " << cPassword << endl;
    cout << "Access granted\n";
  } else {
    cout << "Wrong username and password\n";
  }

  return 0;
}

// How long username, how long password needed?
// Can we go too long?
// Can we make the auth value something specific, rather than just 1? How?
// 0123456789abcdef1 as a password is buffer overflow
// How do we modify this binary to break the security?“If a program is useful, it must be changed.
If a program is useless, it must be documented.”
- Ed Jorgensen (asm book)
You can’t just simply disassemble to validly re-assembleable
code.
You can’t easily just use objdump to re-generate assembly,
modify that assembly, and then re-compile.
To modify, it’s messier:
#!/bin/bash
g++ -g buffer-overflow.cpp -o buffer-overflow.out
ghex buffer-overflow.out &
objdump -M intel -d buffer-overflow.out | less
# /main
# search for hex values you want to change in binary
# find them in the binary, change!
# OR
# attach to stripped binary in qtcreator, trace, looking for jumps
# pritning strings: x/sb $rsi
# or printing numeric values to compareTry this with the buffer overflow program to crack the password or access.
ctrl-shift-g lets you edit the binary.
Step 0 (preparation)
After you’ve actually disassembled the file properly with objdump -D or
whatever you normally use first to actually understand it, and find the
spots you need to change, then you’ll need to take note of the following
things to help you locate the correct bytes to modify:
The “address” (offset from the start of the file) of the bytes you
need to change.
The raw value of those bytes as they currently are (the –show-raw-insn
option to objdump is really helpful here).
Step 1
Dump the raw hexadecimal representation of the binary file with hexdump
-Cv.
Step 2
Open the hexdumped file and find the bytes at the address you’re looking
to change.
Quick crash course in hexdump -Cv output:
The left-most column is the addresses of the bytes (relative to the start of the binary file itself, just like objdump provides).
The right-most column (surrounded by | characters) is just “human readable” representation of the bytes - the ASCII character matching each byte is written there, with a . standing in for all bytes which don’t map to an ASCII printable character.
The important stuff is in between - each byte as two hex digits separated by spaces, 16 bytes per line.
Beware: Unlike objdump -D, which gives you the address of each instruction and shows the raw hex of the instruction based on how it’s documented as being encoded, hexdump -Cv dumps each byte exactly in the order it appears in the file. This can be a little confusing as first on machines where the instruction bytes are in opposite order due to endianness differences, which can also be disorienting when you’re expecting a specific byte as a specific address.
Step 3
Modify the bytes that need to change - you obviously need to figure out
the raw machine instruction encoding (not the assembly mnemonics) and
manually write in the correct bytes.
Note: You don’t need to change the human-readable representation in the right-most column. hexdump will ignore it when you “un-dump” it.
Step 4
“Un-dump” the modified hexdump file using hexdump -R
++++++++++++ Cahoot-13b.12
https://en.wikipedia.org/wiki/Macro_(computer_science)
A macro is a shortcut for a sequence of commands,
more lightweight than a function.
A macro behaves like a function,
but without the overhead and scope complexity.
Macros are replaced with unpacked code,
at pre-processing stages of compilation.
In asm source code files,
macros should be placed above the data section
See the book chapter 10 for more detail.
General definition:
%macro <name> <number of arguments>
    ; [body of macro]
%endmacro
For example, an absolute value macro:
%macro abs 1
    cmp %1, 0
    jge %%done
    neg %1
%%done:
%endmacro
Note: any labels in a macro should have %% at the start.
The above macro be used as follows:
mov eax, -3
abs eax
The process of elaborating a macro is handled during
pre-processing,
in the compilation process,
so macros do not incur run-time overhead.
Functions are similar to macros,
in that they are callable chunks of code,
but they require greater overhead,
having their own full local scope,
unpacked at run-time rather than compile-time.
During runtime, execution is re-directed away from the current
calling function,
to another location in memory where the callee function
lives,
and then returned back to the calling function.
Function calls involve two main actions:
global <procName>
<procName>:
    ; function body
ret
In asm source code functions must:
Defines how to:
jump around in the code,
pass values, and
leave everything like you found it!
https://en.wikipedia.org/wiki/Calling_convention
https://en.wikipedia.org/wiki/X86_calling_conventions
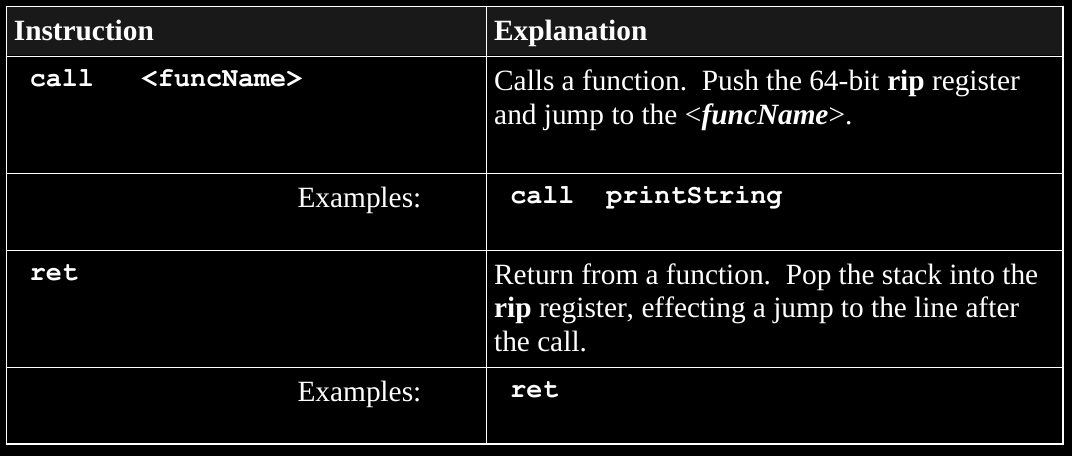
call
The call operation works by saving the address of where to return
to,
when the function completes (referred to as the return address).
This is accomplished by placing contents of the rip
register on the stack.
Recall that the rip register causally points to the next
instruction,
to be executed, which should be the instruction immediately after the
call.
After saving rip on the stack, call jumps to
the function name label.
ret
ret instruction is used in a procedure to return the flow
of execution.
This instruction pops the current top of the stack (at
rsp) into the rip register.
Thus, the appropriate return address is restored.
Note: this is not for returning values (we use rax for
that)!
Note: Any items pushed in a function call must be popped!
++++++++++++ Cahoot-13b.13
++++++++++++ Cahoot-13b.14
Also known as call frame, activation record, etc.
This is any data that gets stored on the stack for an ongoing function
call.
What goes in a stack frame?
Setup before call
By convention, the potential first six integer arguments are passed
in registers, in this order:
rdi, rsi, rdx, rcx,
r8, r9
The 7th and greater arguments are passed via the stack.
push the arguments on the stack in reverse order (right to
left, so that the first stack argument specified in the function call is
pushed last).
On the x86-64bit platform, pushed arguments are passed as
quadwords.
The caller executes a call instruction to pass control to
the function (callee).
The callee does it’s thing (below).
After the callee function returns execution to the calling function
(i.e., finishes):
the caller clears stack-based arguments from the stack, e.g.,
add rsp, <argCount*8>
The caller can choose to read the value of rax as a
returned value, if any.
We can break down the callee’s operations into a prologue, execution,
epilogue.
These are not formal sections, just a way to think about it.
Function Prologue (at the beginning of the function’s operations)
If arguments are passed on the stack, the callee must save the
caller’s rbp to the stack,
and move the value of rsp into the new
rbp.
This allows the callee to use it’s own rbp as a frame
pointer to access arguments on the stack in a uniform manner.
The callee may then access its parameters relative to
rbp.
The quadword at [rbp] holds the previous value of
rbp as it was pushed.
The next quadword, at [rbp+8], holds the return address,
pushed by the call.
The parameters start after that, at [rbp+16].
If local variables are needed, the callee decreases rsp
further, to allocate space on the stack for the local variables.
The local variables are accessible at negative offsets from
rbp.
If a register is to be altered, the caller’s values in the
registers:
rbx, r12, r13, r14,
r15 and rbp
must be saved on the stack for later (to leave it like you found
it).
Function Execution (during the call)
The function code is executed.
Function Epilogue (at the end of the function’s operations,
not back in the caller yet)
Restores any pushed registers.
If local variables were used, the callee restores the address-value in
rbp into rsp to clear the stack-based local
variables, giving the caller back their original rsp
The callee restores (via pop) the previous caller’s value
of rbp.
The callee, if it wishes to return a value to the caller, should leave
the value in the ‘a’ register: al, ax,
eax, rax, depending on the size of the value
being returned.
A floating-point result should be returned in xmm0.
The call returns via ret (return), which uses
pop to move the top of the stack (which now is the return
address) into rip causing execution to head back to just
after the original call
++++++++++++ Cahoot-13b.15
Reminder:
In asm:
db 8-bit variable(s)
dw 16-bit variable(s)
dd 32-bit variable(s)
dq 64-bit variable(s)
ddq 128-bit variable(s) integer
dt 128-bit variable(s) float
(in GDB, or via any of the above front-end IDEs for GDB)
In qtcreator to access the GDB terminal: Right click view options->Views->Debugger Log
Type at the GDB prompt:
x/<n><f><u> &<variable>
where:
<n> number of locations to display, and 1 is
default.
<f> format:
d – decimal (signed)
x – hex
u – decimal (unsigned)
c – character
s – string
f – floating-point
<u> unit size:
b – byte (8-bits)
h – halfword (16-bits)
w – word (32-bits)
g – giant (64-bits)
64 bit registers are g by default
<variable> is memory location
For example, to display a variable declared by this asm code:
qnum dq 1234567890
Type this at the GDB prompt:
x/dg &qnum
There are some occasions when displaying the contents of the stack
may be useful.
The stack is normally comprised of 64-bit, unsigned elements.
The examine memory command is used; however the address is in the rsp
register (not a variable name).
For example, to display the top 6 items on the stack would be
as follows:
x/6ug $rsp
When you are not sure about the encoding, try a bunch of them:
x/ub $rsp
x/uh $rsp-20
x/uw $rsp-0x14
...
etc.. or use qtcreator to do the same.
Trace this code when compiled with the g++ -g
flag:
once in C++ code mode, and
once in asm instruction mode.
This C++ code will be compiled as below:
ReverseEngineering/asm_demos.tar.xz
qtcreator/function_demo/main.cpp linked to
function_demo.cpp
// Simple program for basics of reversing
// Does not have any includes, to keep it clean and simple
// Trace once over C++, then over ASM,
// then over ASM while using GDB to inspect stack

int add_one(int incoming) {
  // x/xg $rsp to see what rip is saved
  int one = 1;
  // x/2ug $rsp
  // x/2wg $rsp

  // notice the debugger skis this line
  // when stepping here (pre-allocation)
  int local_var;

  local_var = incoming + one;

  return local_var;
}

int ref_stuff(int &incoming, int arg_array[]) {
  incoming++;
  arg_array[1] = 4;
  int local_array[2]{2, 2};
  return local_array[1];
}

int main() {
  int start_num = 7;
  int start_num1 = 7;
  int start_num2 = 7;
  // (gdb) x/ub $rbp-4

  start_num = add_one(start_num);

  int main_array[3];
  main_array[2] = 1;

  // Passing as array to a function by reference
  int another_stack_var = 4;
  int yet_another_var = ref_stuff(another_stack_var, main_array);

  return 0;
}
How to generate relevant files corresponding to a gdb trace:
#!/usr/bin/env bash
# on the simple c++ program above

# at&t flavor
g++ -S funcs.cpp

# or to get Intel instead of AT&T
g++ -S -masm=intel funcs.cpp

# view
vim funcs.s

g++ -g funcs.cpp

# at&t
objdump -d a.out >funcs_objdump.s

# or for Intel instead of AT&T
objdump -M intel -d a.out >funcs_objdump.asm

# or long version of -M
objdump --disassembler-options=intel -d a.out >funcs_objdump.asm

# view
vim funcs_objdum.asm

# To set the default asm flavor to Intel instead of AT&T in GDB:
cd ~
echo "set disassembly-flavor intel" >.gdbinit

gdb a.out
# > layout next
# > start
# > stepi
# > nexti
# > info frame
# > x/1xg 0x7fffffffdd38
# > x/1ug &intvariablename
# > x/xg $rsp
# > x/xg $rbp

qtcreator
# debug the same program
How to make reversing annoying:
With an interpreted language:
https://pyob.oxyry.com/
With a compiled language:
https://github.com/xoreaxeaxeax/movfuscator
https://www.youtube.com/watch?v=R7EEoWg6Ekk
ReverseEngineering/move-is-turing-complete.pdf
The first step to finding what you are looking for, is to know what
you are looking for.
Which functions are ‘interesting’ is entirely dependent on your point of
view.
Are you looking for copy protection?
How do you suspect it is done.
When in the program execution does it show up?
Are you looking to do a security audit of the program?
Is there any sloppy string usage?
Which functions use strcmp, sprintf,
etc?
Which use malloc?
Is there a possibility of improper memory allocation?
What about the code before and after main??
Either:
In gdb, use starti instead of start,
and
use stepi to step all the way deep the whole way
through!
See the objdump or ndisam output from
above.
Use a real professional debugger (below).
Newly released NSA reverse engineering software.
Install if you dare :)
It was leaked,
and so the NSA decided to open source it,
as an outreach advertisement:
https://code.nsa.gov/
When you have 35,000 employee’s at the NSA,
it’s ironically hard to keep information secret…
https://en.wikipedia.org/wiki/National_Security_Agency
Show in lecture:
https://github.com/NationalSecurityAgency/ghidra/wiki/files/recon2019.pdf
https://en.wikipedia.org/wiki/Ghidra
https://www.nsa.gov/resources/everyone/ghidra/
https://ghidra-sre.org/
https://github.com/NationalSecurityAgency/ghidra
https://ghidra-sre.org/InstallationGuide.html
https://ghidra-sre.org/CheatSheet.html
https://code.nsa.gov
https://danielmiessler.com/blog/why-i-think-the-nsa-is-releasing-a-free-reverse-engineering-tool-this-year-at-rsa/
Basic video intro:
https://www.youtube.com/watch?v=fTGTnrgjuGA
An online course:
https://ghidra.re/online-courses/