https://en.wikipedia.org/wiki/Biological_network (show
this page in lecture)
https://en.wikipedia.org/wiki/Gene_co-expression_networks
https://en.wikipedia.org/wiki/Gene_regulatory_network
https://en.wikipedia.org/wiki/Metabolic_network
https://en.wikipedia.org/wiki/Metabolic_network_modelling
https://en.wikipedia.org/wiki/Interactome
https://en.wikipedia.org/wiki/Network_medicine
https://en.wikipedia.org/wiki/Human_disease_network
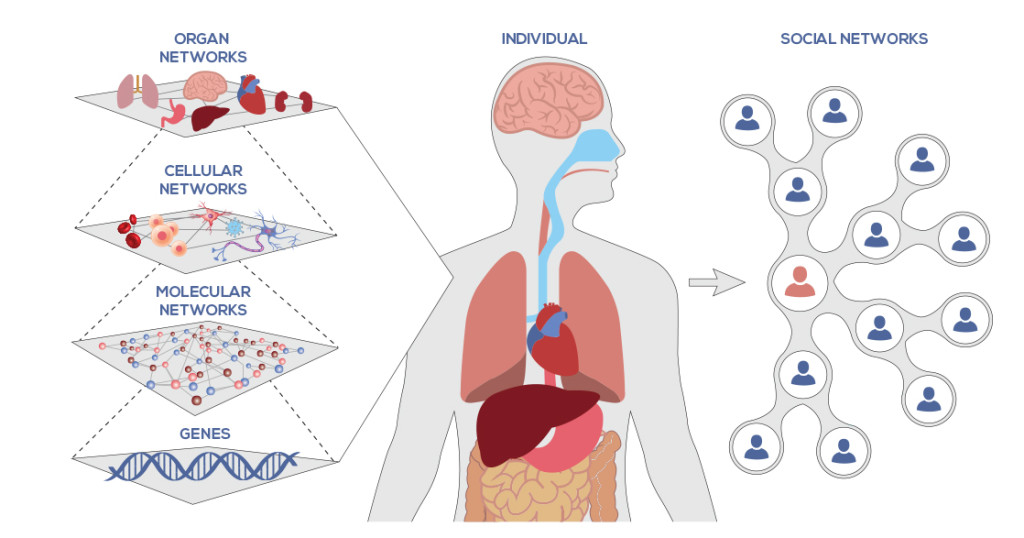
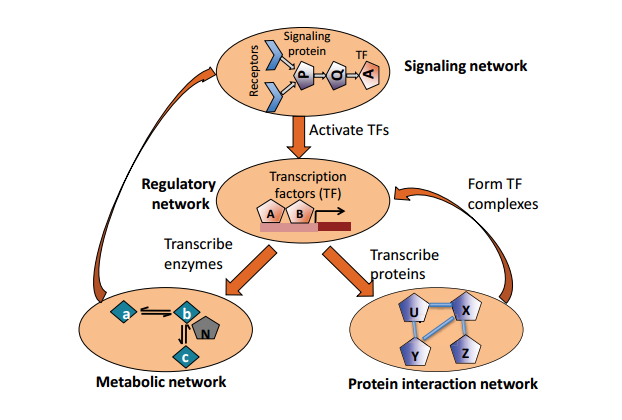
Individual biological networks, that is layers,
can themselves be considered nodes in a larger network,
representing the entire biological system.
We can, for example, have:
a signaling network sensing the environment,
governing the expression of transcription factors (TF).
In this example, the network would display that:
TFs govern the expression of proteins, and
proteins can play roles as enzymes in metabolic pathways, etc.
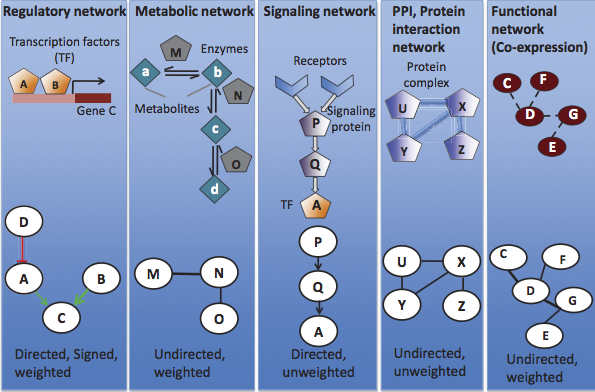
Protein Networks display physical interactions between proteins.
Protein-Protein Interaction (PPI)
occurs when two or more proteins bind together,
often to carry out their biological function.
Many of the most important molecular processes in the cell,
such as DNA replication,
are carried out by large molecular machines,
that are built from a large number of protein components,
organized by their protein-protein interactions.
Protein-protein interactions in a cell form protein
interaction networks (PINs),
where proteins are nodes, and their interactions are edges.
PINs are the most widely analyzed networks in biology.
There are dozens of PPI detection methods to identify such
interactions.
The yeast two-hybrid system is a commonly used
experimental technique for the study of binary interactions.
While molecules can be conserved throughout deep evolutionary
time,
recent studies have indicated conservation of molecular networks
themselves.
Proteins with high degrees of connectedness,
are more likely to be essential for survival,
than proteins with lesser degrees.
This suggests that the overall composition of the network,
not simply interactions between protein pairs,
is important for the overall functioning of an organism.
An interactome is the whole set of molecular
interactions in a particular cell.
The term specifically refers to physical interactions among
molecules,
such as those among proteins, denoted protein-protein interactions
(PPIs),
Interactomes also describe sets of indirect interactions among
genes,
known as genetic interactions.
The interactomes based on PPIs,
can be associated with the proteome of the
corresponding species,
in order to provide a global view (“omic”),
of all the possible molecular interactions that a protein can
present.
Example paper:
Structural analysis of the E. coli binary interactome
https://www.nature.com/articles/nbt.2831
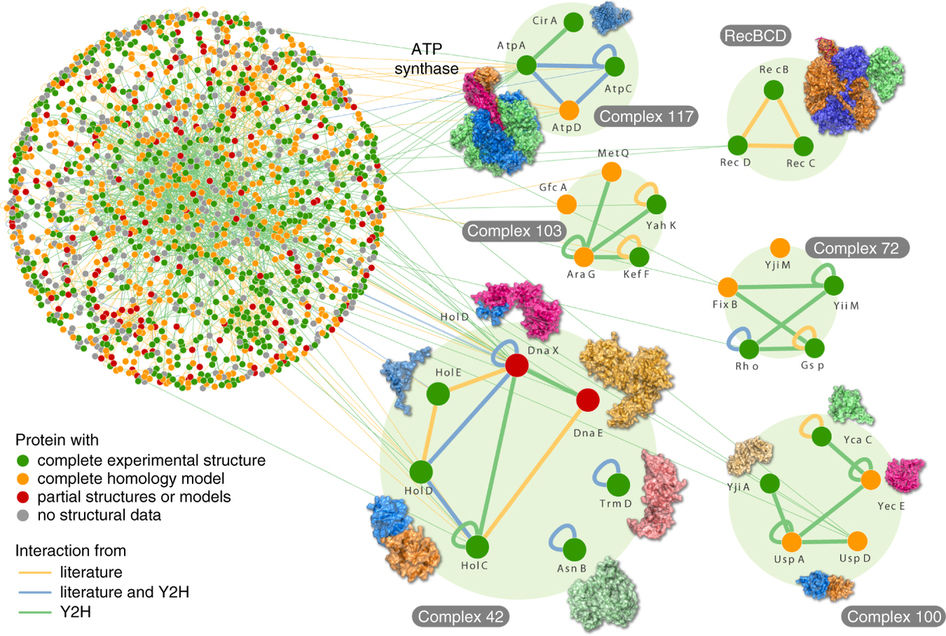
The abstract:
Efforts to map the Escherichia coli interactome have identified several
hundred macromolecular complexes, but direct binary protein-protein
interactions (PPIs) have not been surveyed on a large scale.
Here we performed yeast two-hybrid screens of 3,305 baits against 3,606
preys (∼70% of the E. coli proteome) in duplicate to generate a map of
2,234 interactions, which approximately doubles the number of known
binary PPIs in E. coli.
Integration of binary PPI and genetic-interaction data revealed
functional dependencies among components involved in cellular processes,
including envelope integrity, flagellum assembly and protein quality
control.
Many of the binary interactions that we could map in multi-protein
complexes were informative regarding internal topology of complexes and
indicated that interactions in complexes are substantially more
conserved than those interactions connecting different complexes.
This resource will be useful for inferring bacterial gene function and
provides a draft reference of the basic physical wiring network of this
evolutionarily important model microbe.
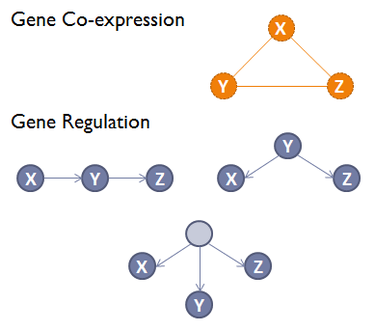
Regulatory Networks represent the set of regulatory interactions in an organism.
Nodes represent regulators (transcription factors) and associated targets.
Edges represent regulatory interaction,
directed from the regulatory factor to its
target.
Edges are signed according to the positive or negative
effect,
and weighted according to the strength of the
reaction.
A gene regulatory network (GRN) is a collection of DNA segments in a
cell,
which interact with each other indirectly,
through their RNA and protein expression products,
and with other substances in the cell,
thereby governing the expression levels of mRNA and proteins.
The regulator can be DNA, RNA, protein and complexes of these.
The interaction can be direct or indirect,
through transcribed RNA or translated protein.
Each mRNA molecule usually goes on to make a specific protein (or set of
proteins).
In some cases this protein will be structural,
and will accumulate at the cell membrane or within the cell,
to give it particular structural properties.
In other cases the protein will be an enzyme,
i.e., a micro-machine that catalyses a certain reaction,
such as the breakdown of a food source or toxin.
Some proteins though serve only to activate other genes,
and these are the transcription factors,
that are the main players in regulatory networks, or cascades.
By binding to the promoter region at the start of other genes,
they turn them on, initiating the production of another protein.
Some transcription factors are inhibitory.
The activity of genes is regulated by transcription factors,
proteins that typically bind to DNA.
Most transcription factors bind to multiple binding sites in a
genome.
As a result, all cells have complex gene regulatory networks.
The human genome encodes roughly 1,400 DNA-binding transcription
factors,
that regulate the expression of more than 20,000 human genes.
Technologies to study gene regulatory networks include:
ChIP-chip, ChIP-seq, CliP-seq, and others.
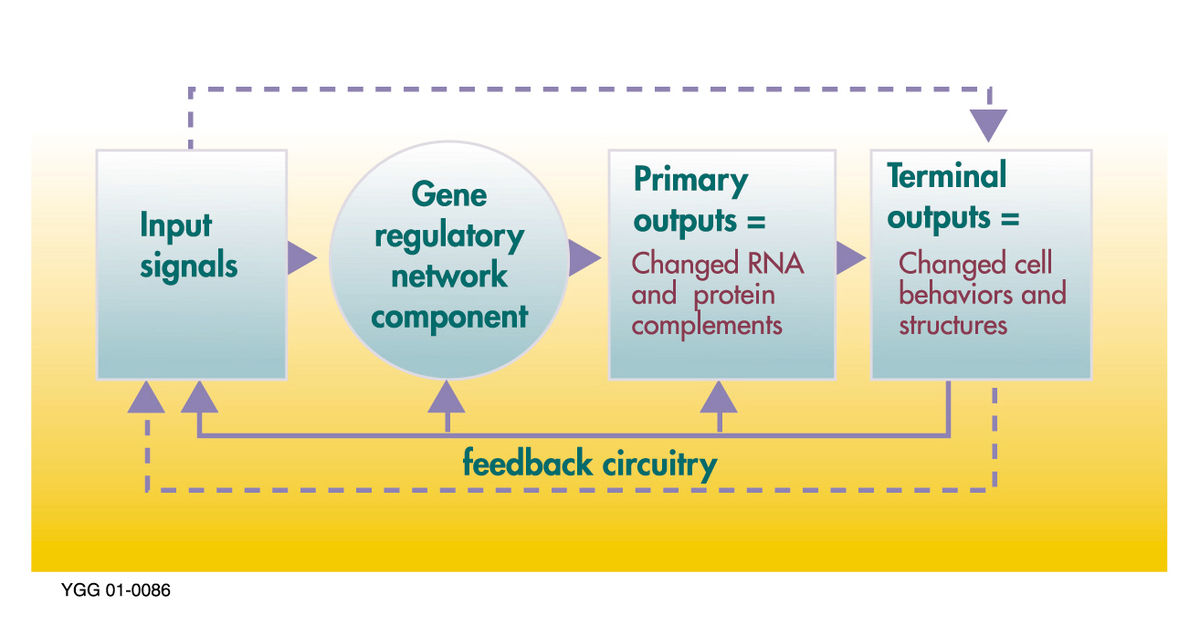
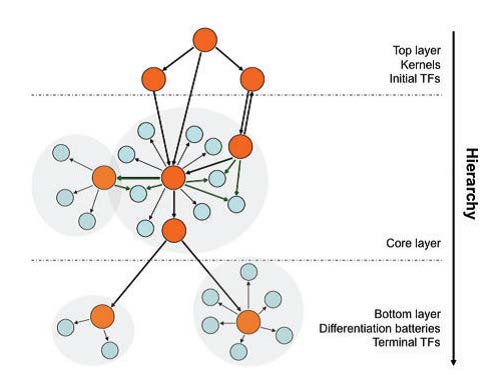
Structure of a gene regulatory network
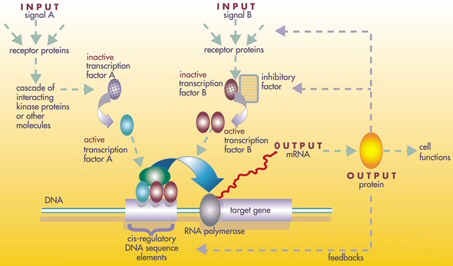
Control process of a gene regulatory network
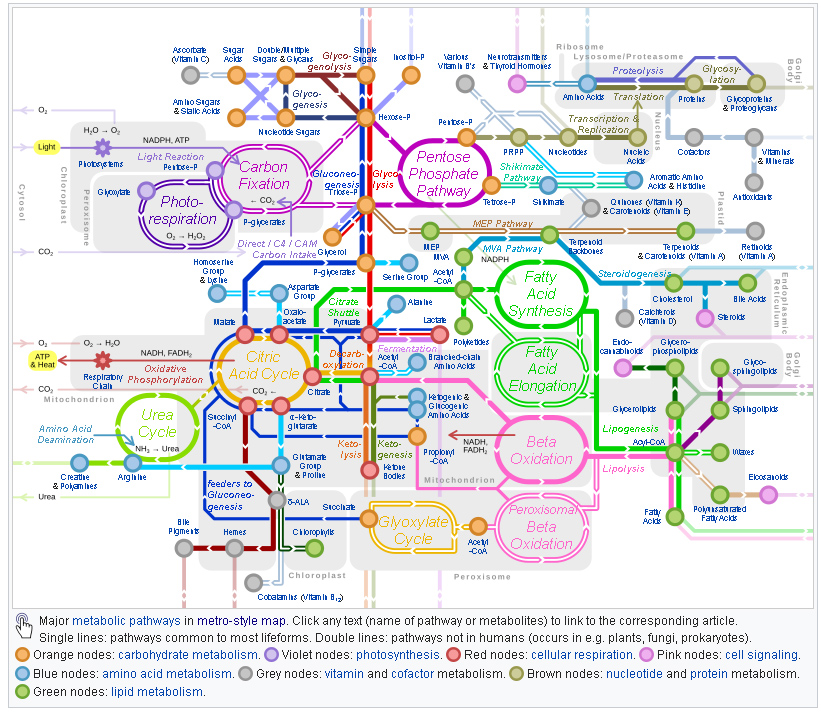
Metabolic Networks connect metabolic
processes.
There is some flexibility in the representation,
but an example is:
a graph displaying shared metabolic products between
enzymes.
Nodes represent enzymes.
Edges represent regulatory reactions,
and are weighted according to the strength of the
reaction.
Edges are usually undirected.
A metabolic network is the complete set of metabolic and physical
processes,
that determine the physiological and biochemical properties of a
cell.
As such, these networks comprise the:
chemical reactions of metabolism,
the metabolic pathways, as well as
the regulatory interactions that guide these reactions.
It breaks down metabolic pathways,
such as glycolysis and the Citric acid cycle,
into their respective reactions and enzymes.
The chemical compounds of a living cell are connected,
by biochemical reactions which convert one compound into another.
The reactions are catalyzed by enzymes.
Thus, all compounds in a cell are parts,
of an intricate biochemical network of reactions,
which is called metabolic network.
Network analyses can infer how selection acts on metabolic
pathways.
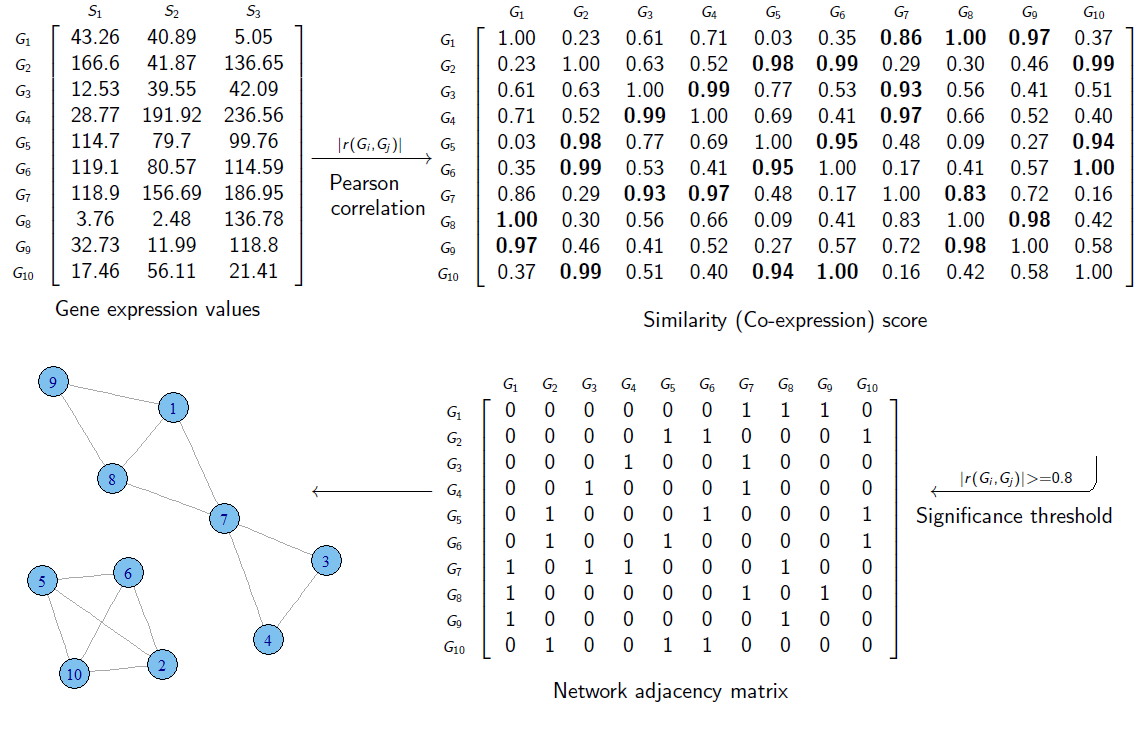
Coexpression Network s describe co-expression functions
between genes.
They represent functional rather than physical interaction
networks,
unlike the other types of networks.
Nodes represent individual genes.
Edges represent co-expression relationships.
These edges are undirected and unweighted.
A gene co-expression network (GCN) is an undirected graph,
where each node corresponds to a gene,
and a pair of nodes is connected with an edge,
if there is a significant co-expression relationship between them.
Gene co-expression networks can be interpreted as:
association networks between variables,
that measure transcript abundances.
These networks have been used to provide a systems biologic analysis
of:
DNA microarray data, RNA-seq data, miRNA data etc.
Weighted gene co-expression network analysis is widely used,
to identify co-expression modules and intra-modular hub genes.
Co-expression modules may correspond to cell types or pathways.
Highly connected intra-modular hubs,
can be interpreted as representatives of their respective module.
Having gene expression profiles of a number of genes,
for several samples or experimental conditions,
a gene co-expression network can be constructed,
by looking for pairs of genes,
which show a similar expression pattern across samples.
The transcript levels of two co-expressed genes,
rise and fall together across samples.
Gene co-expression networks are of biological interest,
since co-expressed genes:
are controlled by the same transcriptional regulatory program,
are functionally related, or
are members of the same pathway or protein complex.
+++++++++++++++ Cahoot-22-01
What data structure we have used already this semester,
that can be used to represent all these networks in cells?
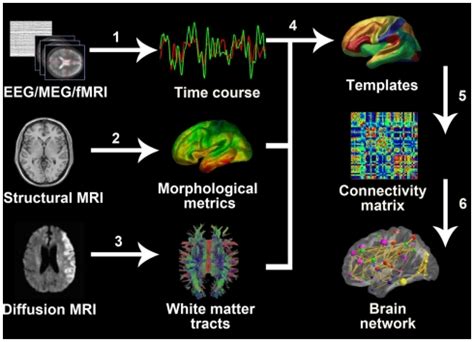
Structural and functional connections between neurons in the brain and body
Nodes represent either neurons, or whole regions.
Edges represent connections, either axons (to neurons), or major pathways (to regions).
Regions:
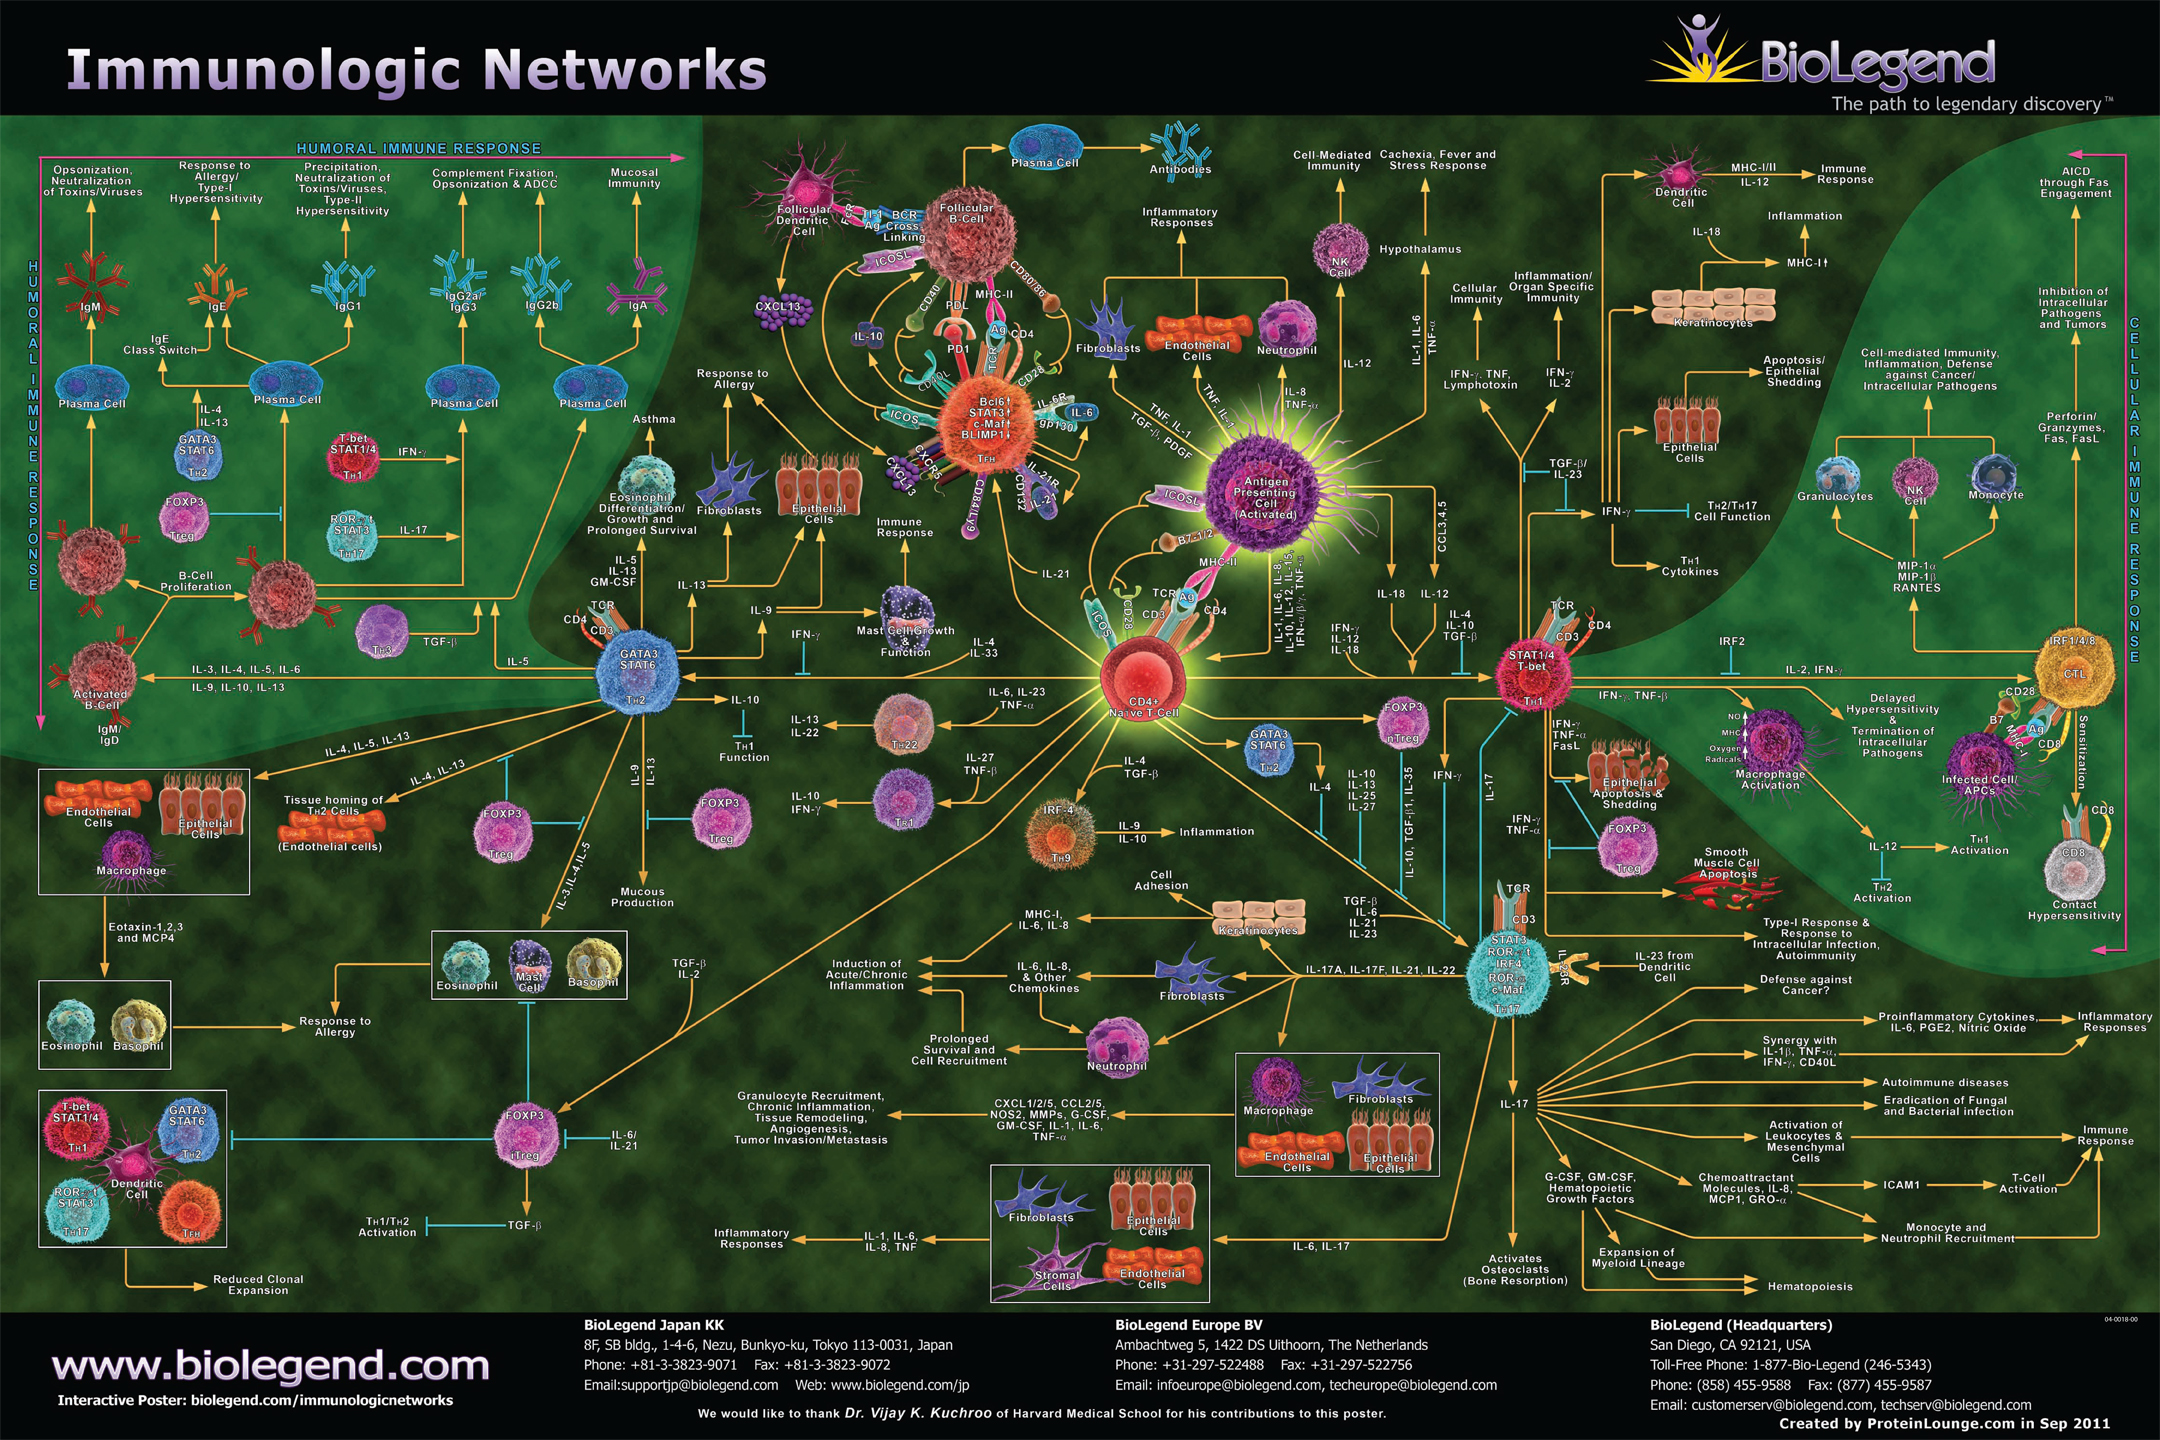
The immune system can be modeled by a network of cellular interactions
Nodes represent?
Edges represent?
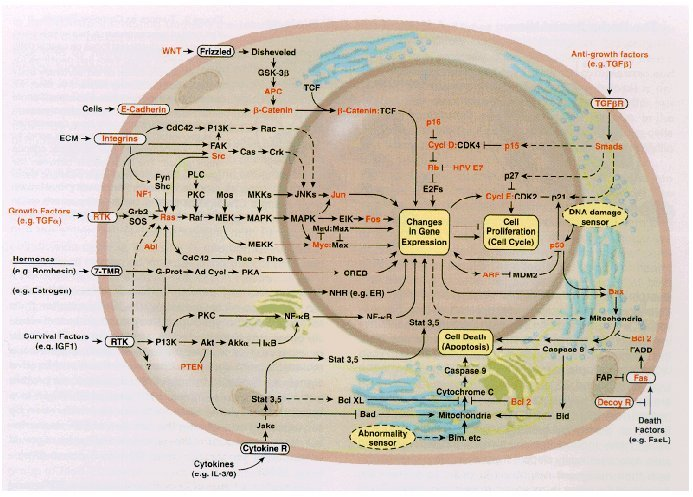
Signaling Networks represent paths of biological signals.
Nodes represent proteins called signaling receptors.
Edges represent transmitted and received biological
signals,
directed from transmitter to receiver.
Edges are directed and unweighted.
Signals are transduced within cells or in between cells,
and thus form complex signaling networks.
For instance, the MAPK/ERK pathway is transduced,
from the cell surface to the cell nucleus,
by a series of protein-protein interactions,
phosphorylation reactions, and other events.
Signaling networks typically integrate:
protein-protein interaction networks,
gene regulatory networks, and
metabolic networks.
A human disease network is a network of human disorders and diseases with reference to their genetic origins or other features.
Nodes represent ?
Edges represent ?
A map of human disease associations referring mostly to disease
genes.
For example, in a human disease network,
two diseases are linked if they share at least one associated
gene.
A typical human disease network usually derives from bipartite
networks,
which consist of both diseases and genes information.
Some human disease networks use other features,
such as symptoms and proteins to associate diseases.
In the “human disease network” (HDN) nodes represent disorders,
and two disorders are connected to each other,
if they share at least one gene,
in which mutations are associated with both disorders
In the “disease gene network” (DGN),
nodes represent disease genes,
and two genes are connected,
if they are associated with the same disorder.
http://www.pnas.org/content/104/21/8685.full
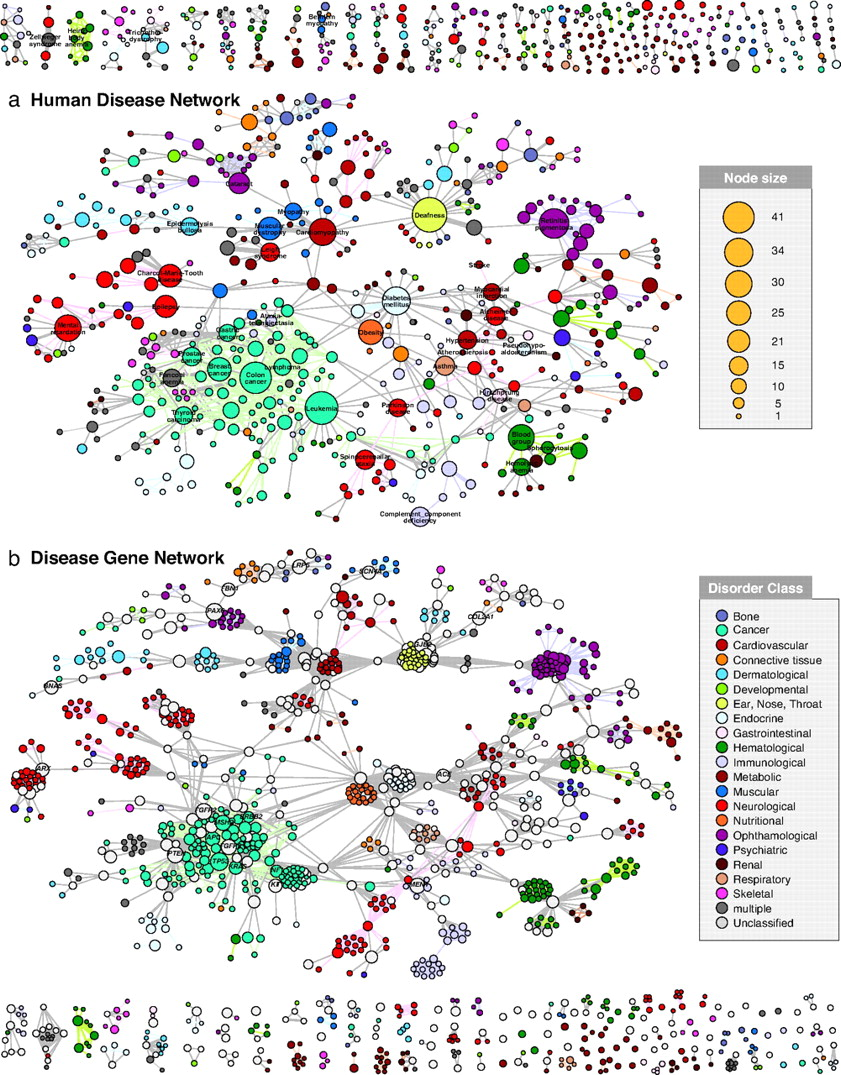
The HDN and the DGN.
* (a) In the HDN, each node corresponds to a distinct disorder, colored
based on the disorder class to which it belongs, the name of the 22
disorder classes being shown on the right.
* A link between disorders in the same disorder class is colored with
the corresponding dimmer color and links connecting different disorder
classes are gray.
* The size of each node is proportional to the number of genes
participating in the corresponding disorder (see key), and the link
thickness is proportional to the number of genes shared by the disorders
it connects.
* We indicate the name of disorders with >10 associated genes, as
well as those mentioned in the text.
* For a complete set of names, see SI Fig. 13.
* (b) In the DGN, each node is a gene, with two genes being connected if
they are implicated in the same disorder.
* The size of each node is proportional to the number of disorders in
which the gene is implicated (see key).
* Nodes are light gray if the corresponding genes are associated with
more than one disorder class.
* Genes associated with more than five disorders, and those mentioned in
the text, are indicated with the gene symbol.
* Only nodes with at least one link are shown.
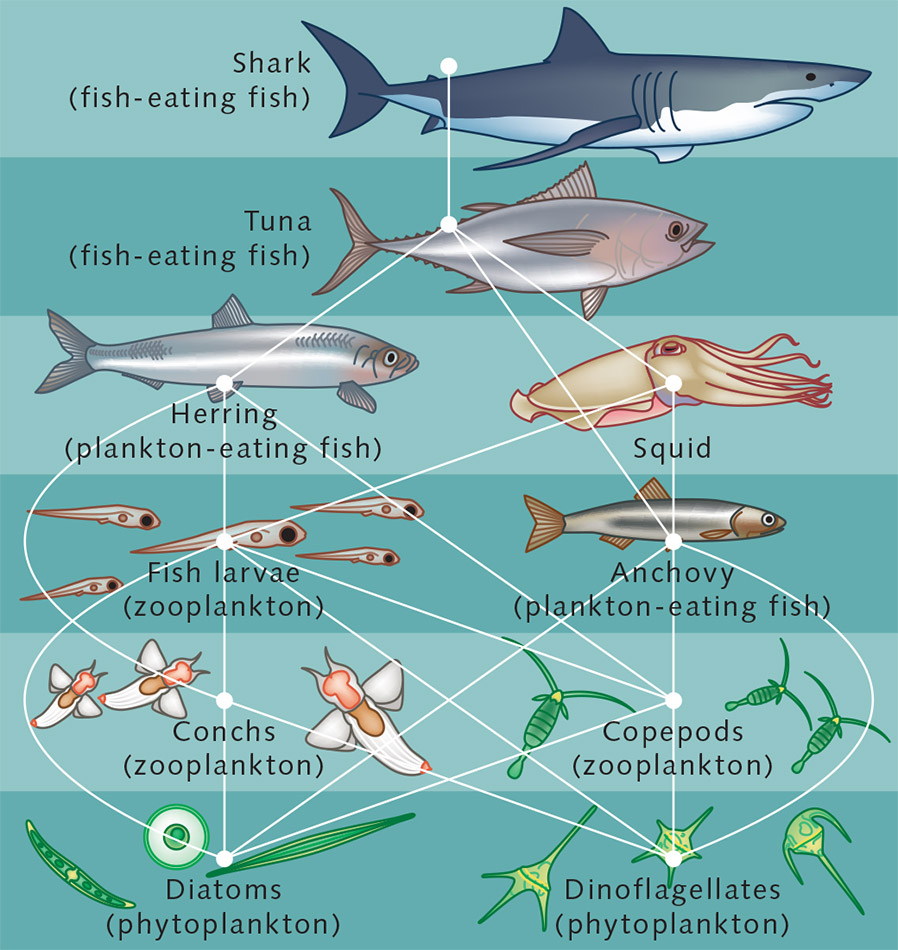
A food web (or food cycle) is a natural interconnection of
food chains,
and a graphical representation (usually an
image),
of what-eats-what in an ecological community.
Nodes represent ?
Edges represent ?
Another name for food web is consumer-resource system.
All organisms are connected to each other through feeding
interactions.
That is, if a species eats or is eaten by another species,
they are connected in an intricate food web of predator and prey
interactions.
The stability of these interactions has been a long-standing question in
ecology.
That is to say, if certain individuals are removed,
what happens to the network (i.e. does it collapse or adapt)?
Network analysis can be used to explore food web stability,
and determine if certain network properties result in more stable
networks.
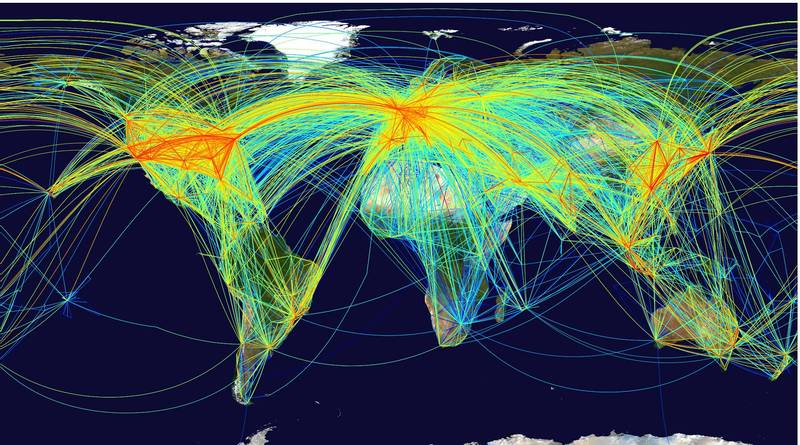
Network analysis can model how selective removals of species,
will influence the food web as a whole.
This is considered within the potential species loss due to human
globalization.
All organisms are connected to each other through feeding
interactions.
That is, if a species eats or is eaten by another species,
they are connected in an intricate food web of predator and prey
interactions.
Describe close and often long-term
interaction,
between two or more different biological species.
Nodes represent ?
Edges represent ?
Epidemiology literally means:
“the study of what is upon the people“.
Used to study the spread of diseases,
e.g. virus infections or sexually transmitted
diseases.
+++++++++++++++++++ Cahoot-22-02
* Nodes represent ?
* Edges represent ?
Networks are typically represented as a graph data structure.
Graphs are composed of
Nodes, which represent objects; and
Edges, which represent connections, or interactions
between nodes.
There are three main ways to think about biological networks as graphs:
Probabilistic Networks
Also known as graphical models.
They model a probability distribution between nodes.
Modeling joint probability distribution of variables using graphs.
Some examples are Bayesian Networks (directed), Markov Random Fields
(Undirected).
Physical Networks
Think of nodes as physically interacting with each other,
and the edges capture that interaction.
Edges represent physical interaction among nodes.
Example: physical regulatory networks.
Relevance Network
Model the correlation between nodes.
Edge weights represent node similarities, or abstract distances.
Example: functional regulatory networks.
Weighted graph
* Edges have an associated weight.
* Weights are generally positive.
* When all the weights are 1, then we call it an unweighted graph.
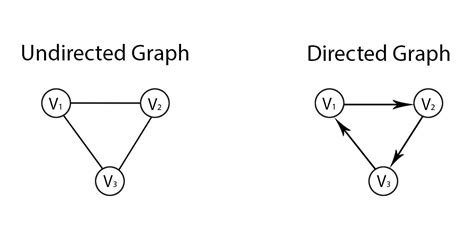
Directed graphs
* Edges possess directionality.
* For example A → B is not the same as A ← B.
* When the edges do not have direction, we call it an undirected
graph.
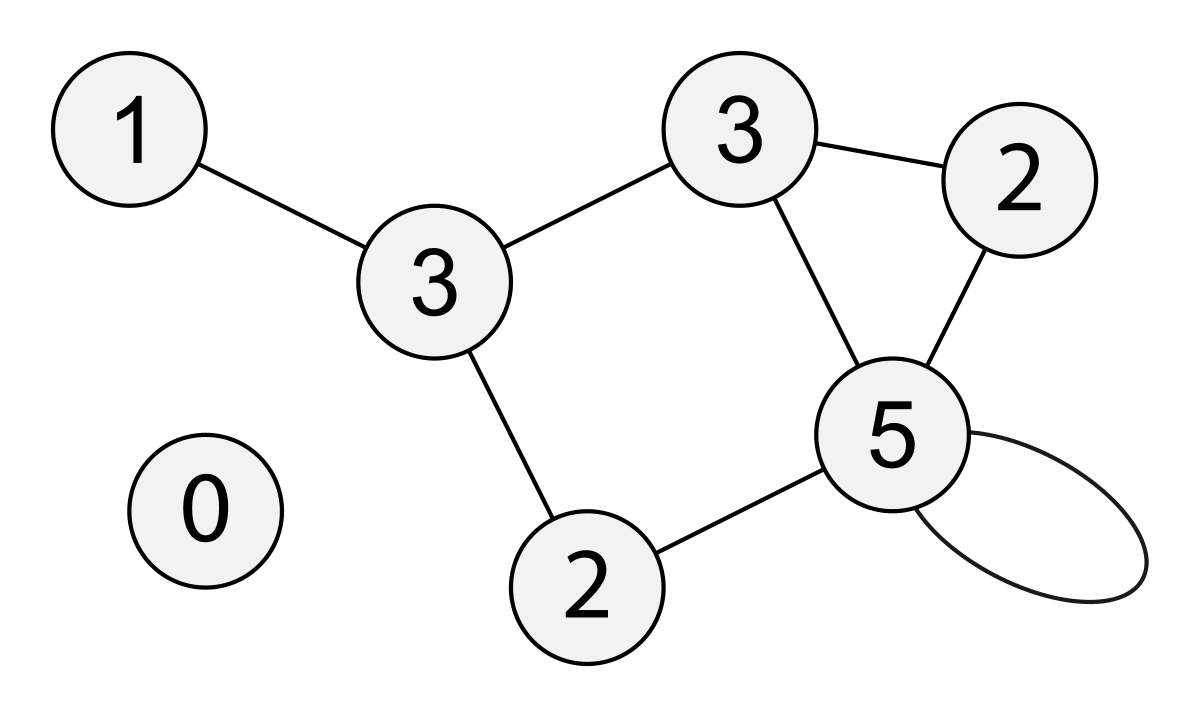
Multigraphs (pseudographs)
* When we allow more than one edge to go between two nodes (more than
two if it’s directed) then we call it a multigraph.
* This can be useful for modeling multiple interactions between two
nodes each with different weights for example.
Simple graph
* All edges are undirected and unweighted.
* Multiple edges between nodes and self-edges are forbidden.
We can also define the “degree” of a whole graph (later).
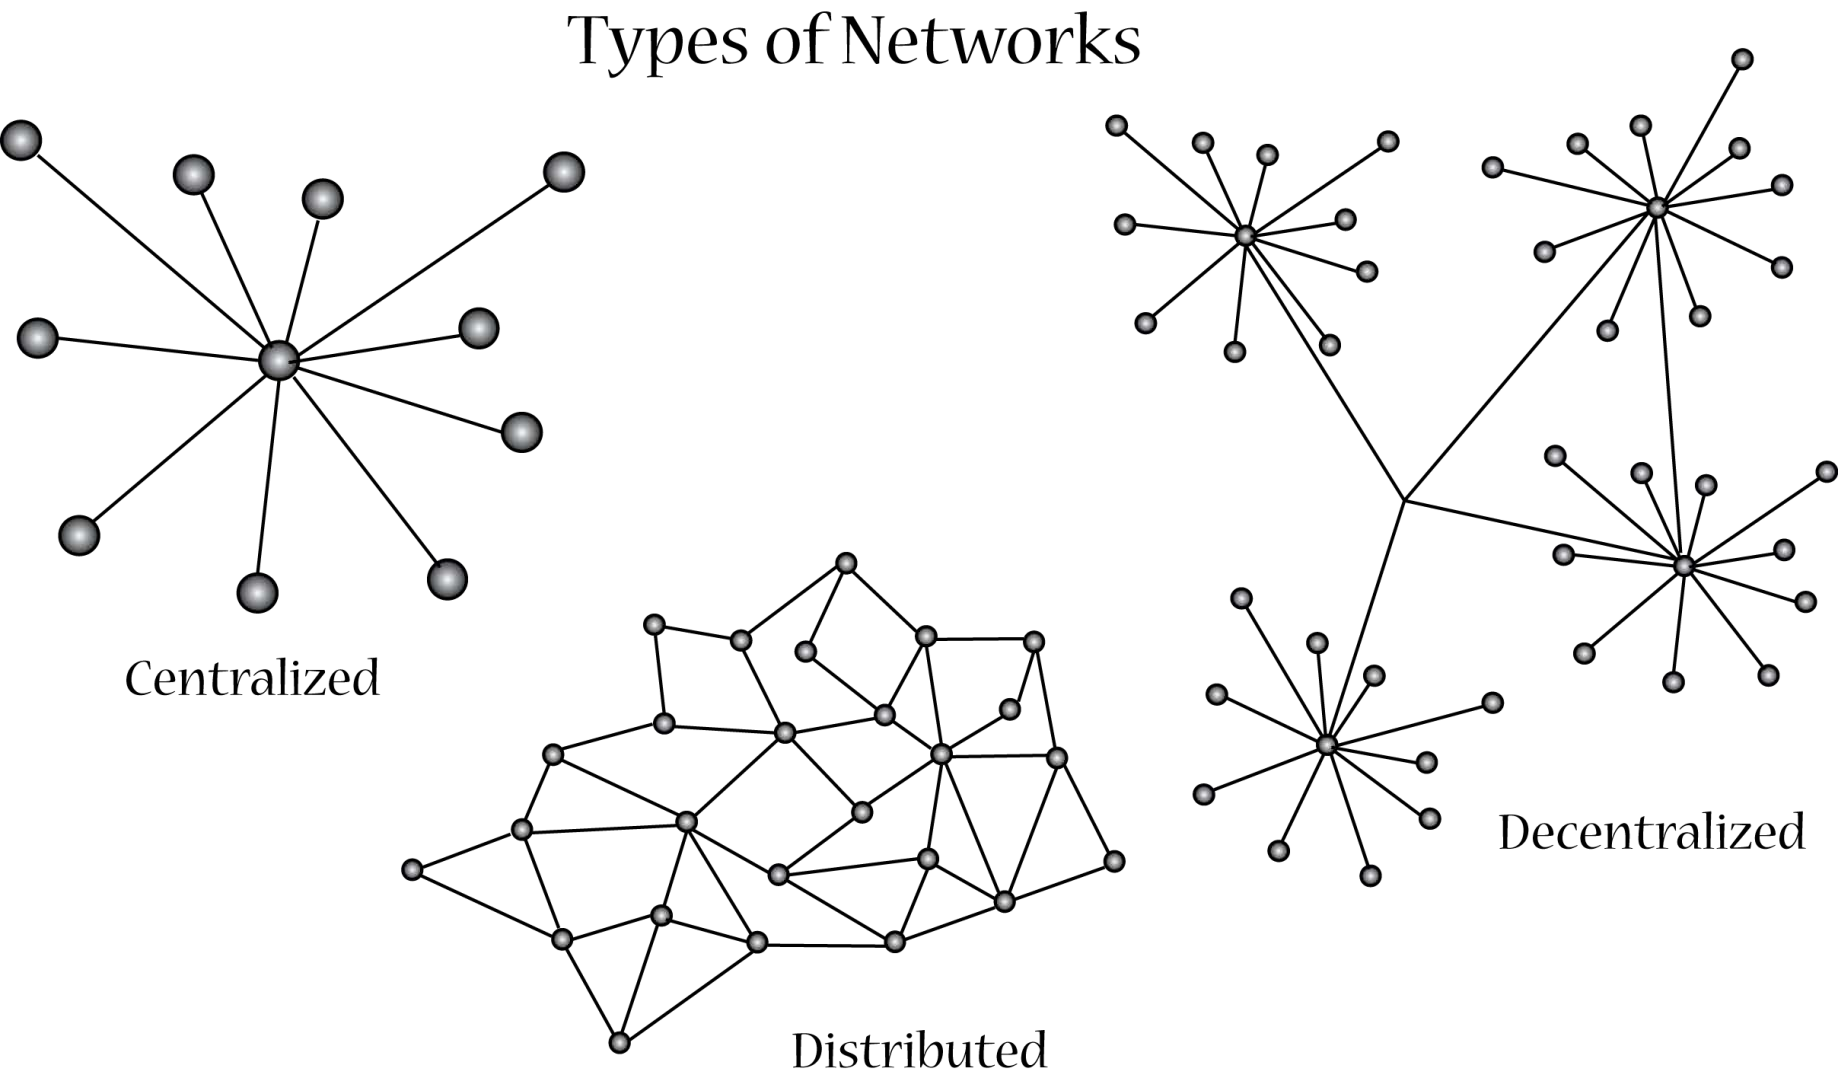
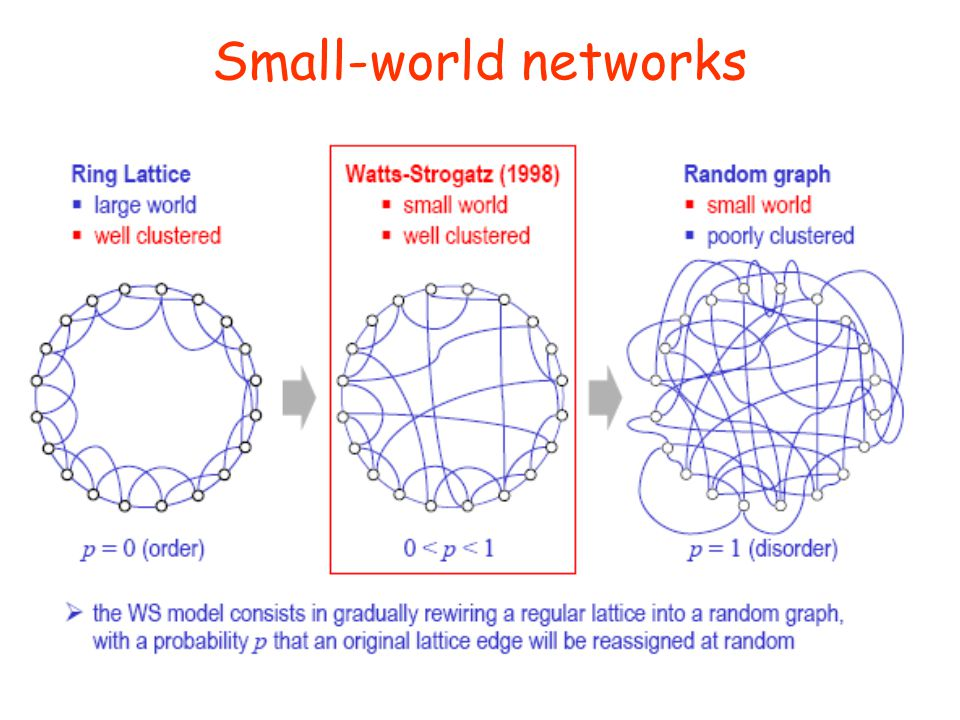
We see this kind of thing in real-world networks:
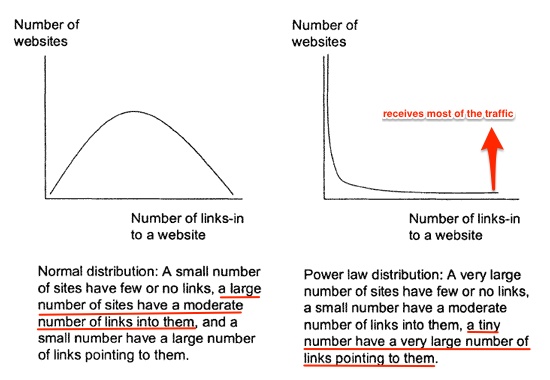
Why?
Every node is connected to every other node,
by only a small number of links.
This property is commonly characterized by:
a small number of central nodes (hubs) with many connections.
The distance between two nodes is:
the smallest number of nodes that have to be traversed,
to connect those two nodes (= shortest path*).
If distance between two nodes is l ~ log N or smaller,
then the network has small world characteristics
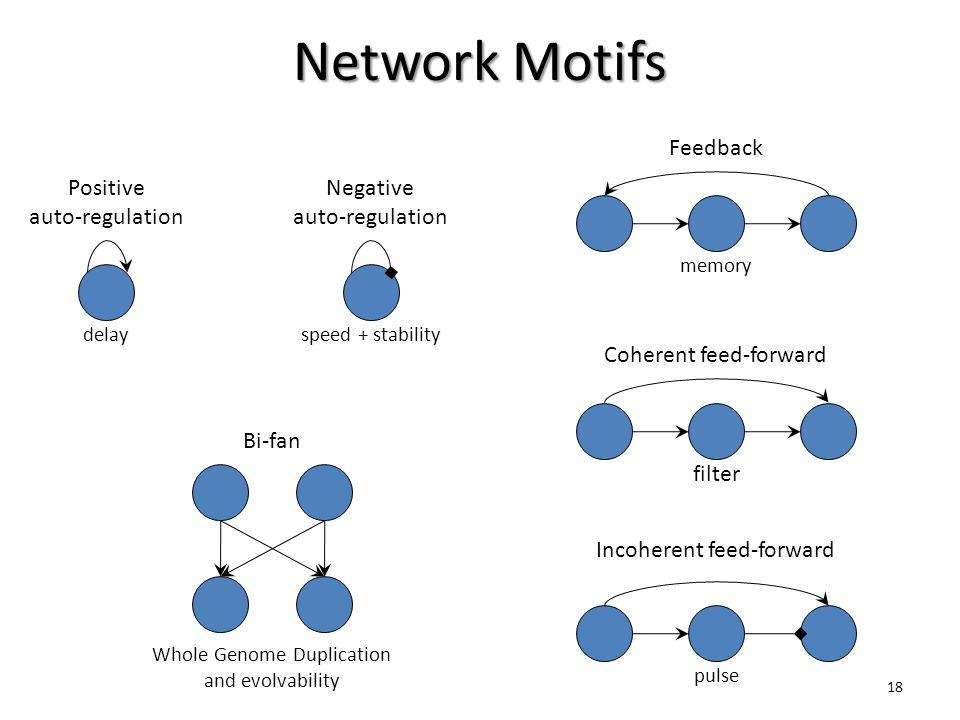
Positive/negative auto-regulation:
in which a transcription factor (TF) enhances/represses its own
transcription.
Feed forward loop:
Consist of two TFs, one regulating the other and both regulating the
same target gene, and can function to accelerate or delay the gene
regulation of the target
Often need to be activated by external or internal
signals
e.g. Neuronal networks:
change in the environment activates a neuronal network,
leading to change in behavior
Links can be modified to achieve different
outputs
e.g. Gene regulatory network:
cells activate different TFs at different times,
or locations during development, which affects cell fate
Links can be added or removed
e.g. Social networks: new friendships or breaking up of friends
Changes over evolutionary time scales
e.g. all molecular networks: duplication of genes, mutations of genes
etc.
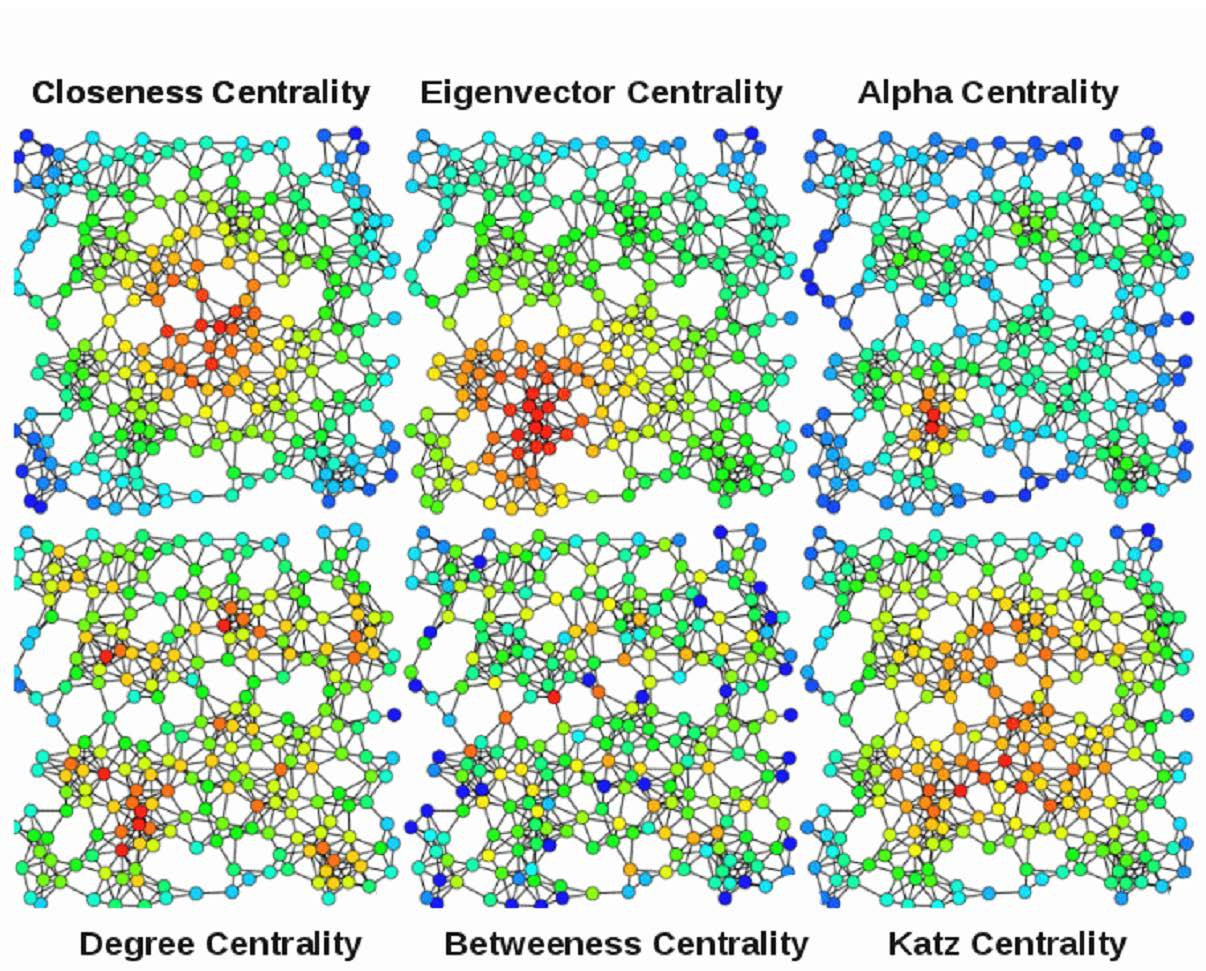
Assuming these are biological networks,
which nodes are most important?
Next: 23-GraphTheory.html